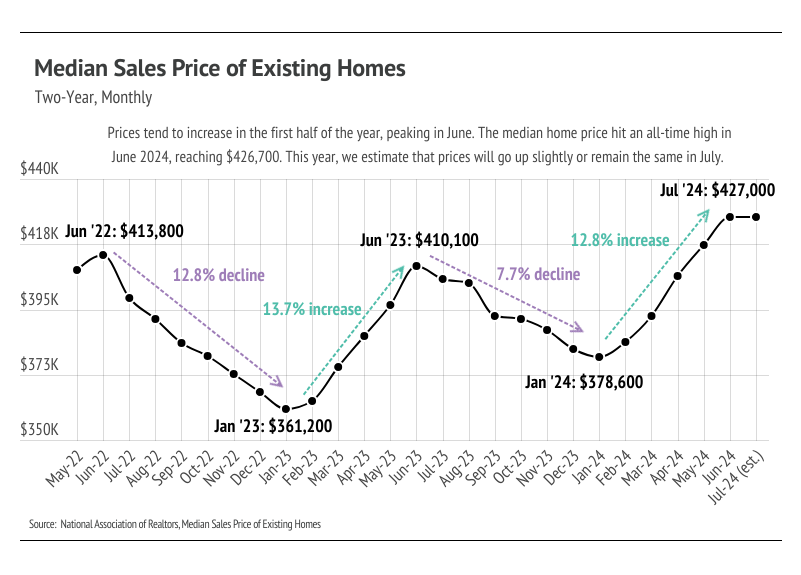
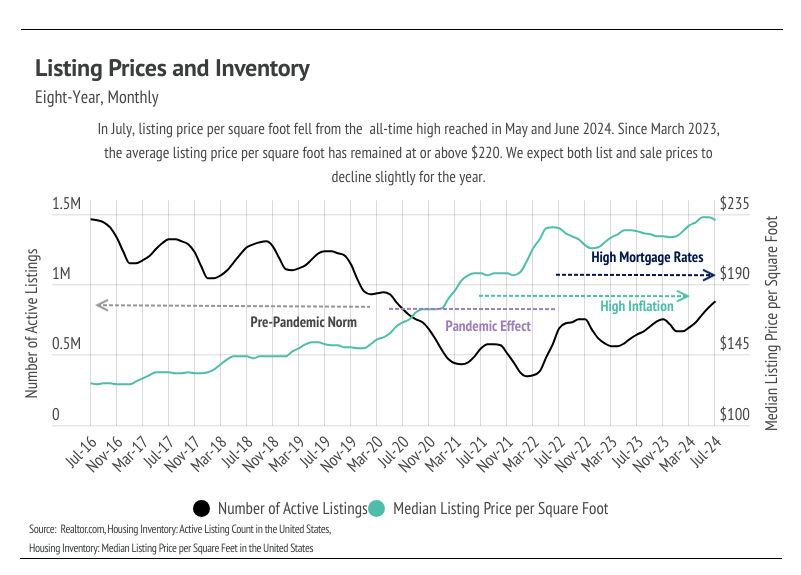
In June, prices rose for the fifth month in a row, reaching all-time highs. Typically, home prices begin to fall in July, but this year may be different. Currently, we estimate data to show that the national median home price rose very slightly in July. We are confident, at least, that prices have not fallen 5% from June to July, which means that July was the 13th consecutive month of year-over-year price growth. Despite the seasonal price dip, which is surely coming in the second half of the year, year-over-year price growth will almost certainly continue for months to come.
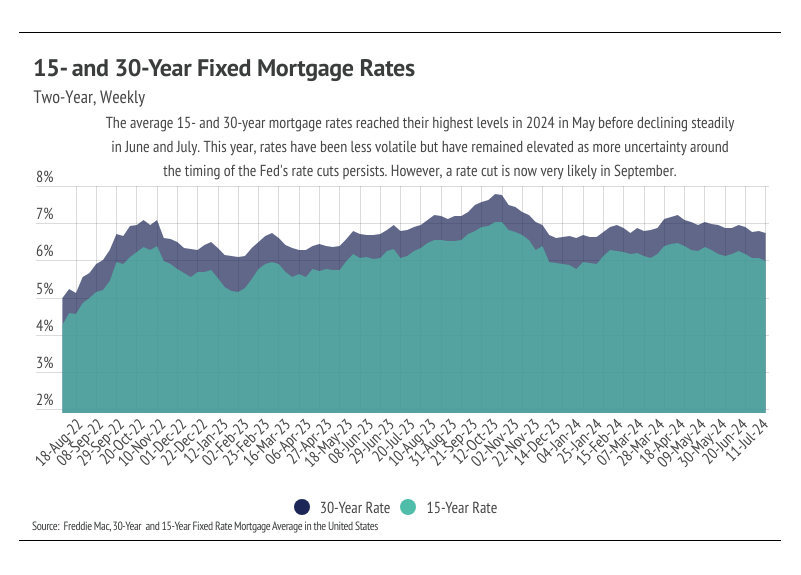
So why won’t prices see a major shift downward in the second half of the year? Seasonal trends already dictate that prices will decline starting around now. Combine that with high mortgage rates, slowing sales, and the highest inventory in four years, and it seems like we have the perfect recipe for prices to fall significantly. While home prices tend to increase over time, the pandemic buying boom set the stage for prices to rise more quickly than expected, and to stay high. In a funny way, higher interest rates have been incentivizing higher prices due to the cost of selling and buying at the same time. From June 2019 to March 2022, the average 30-year mortgage rate was less than 4%, and the averages for all of 2020 and 2021 were 3.11% and 2.95%, respectively. All that to say, those buyers who purchased their homes through financing, as most buyers do, in 2020 or 2021, and who plan to buy their next homes through financing at a much higher rate — they need to sell their current homes for much higher to combat the cost of financing new ones.
To further the point, the cost of financing the median home in June 2024 has increased 83% compared to June 2021, even though the sticker price of the median home is only up 16%. However, let’s say you bought the median home in June 2021 with 20% down, and then in June 2024, both sold your old median price home and bought the June 2024 median price home, your mortgage would only go up 55% rather than 83% because of the $60,000 price appreciation, which would bring you to ~30% equity in the new home. To be clear, 55% is still a lot, but it’s better than 83%.
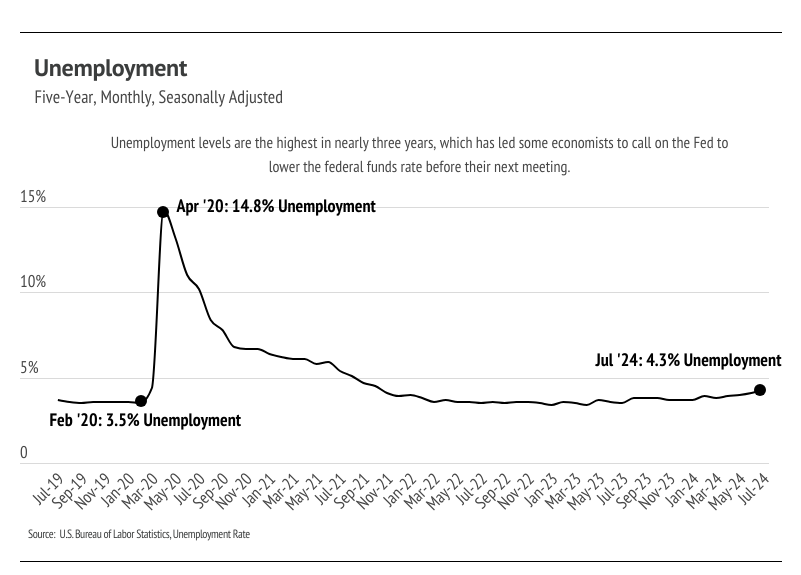
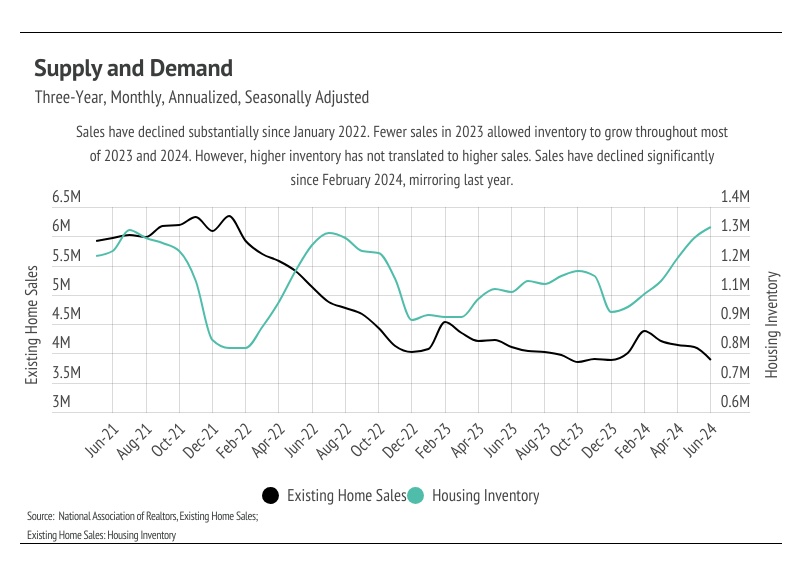
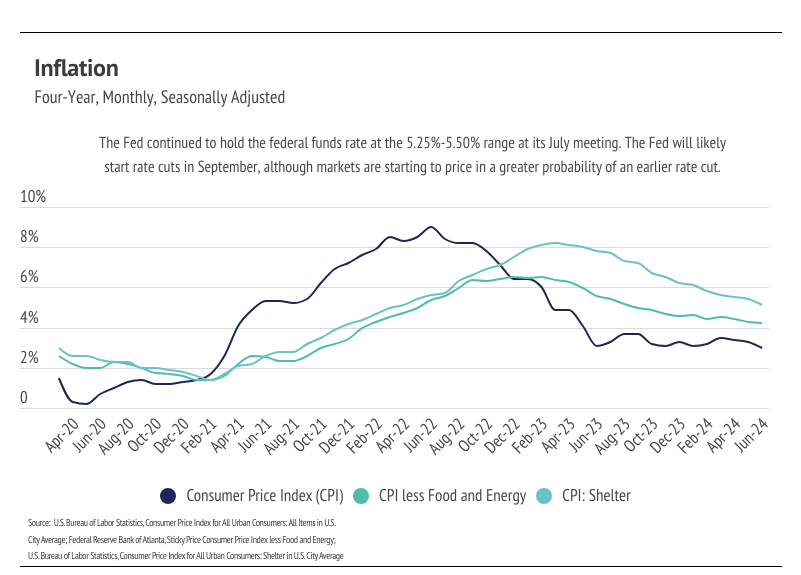
Overall, inventory growth is great news for the undersupplied U.S. housing market. According to data from realtor.com, inventory reached its highest level since June 2020. The increasing inventory level should cause rising home prices to slow. In the pre-pandemic seasonal trends, sales, new listings, inventory, and price would roughly all rise in the first half of the year and decline in the second half of the year. Sales and new listings have been far lower than usual since mortgage rates started climbing, which is to be expected. Because we don’t anticipate sales to pick up until the spring of 2025, inventory could easily continue to grow in the second half of the year. Fed rate cuts will come right when the market really starts to slow down, so they probably won’t drive the market into a buying frenzy in the fourth quarter.
Different regions and individual houses vary from the broad national trends, so we’ve included a Local Lowdown below to provide you with in-depth coverage for your area. As always, we will continue to monitor the housing and economic markets to best guide you in buying or selling your home.
Big Story Data
The Local Lowdown
Quick Take:
-
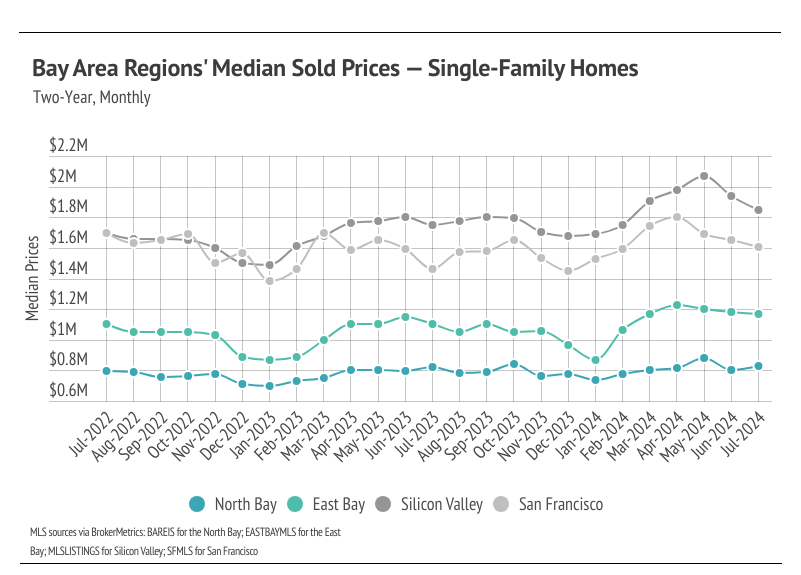
The median single-family home prices are still near their record highs. We expected price contraction after peaking in the second quarter, which is the seasonal norm. Prices will likely decline for the rest of the year.
-
Total sales in the Bay Area fell slightly month over month, which is the seasonal norm. We expect inventory to decline and the overall market to slow as we make our way through the second half of the year.
-
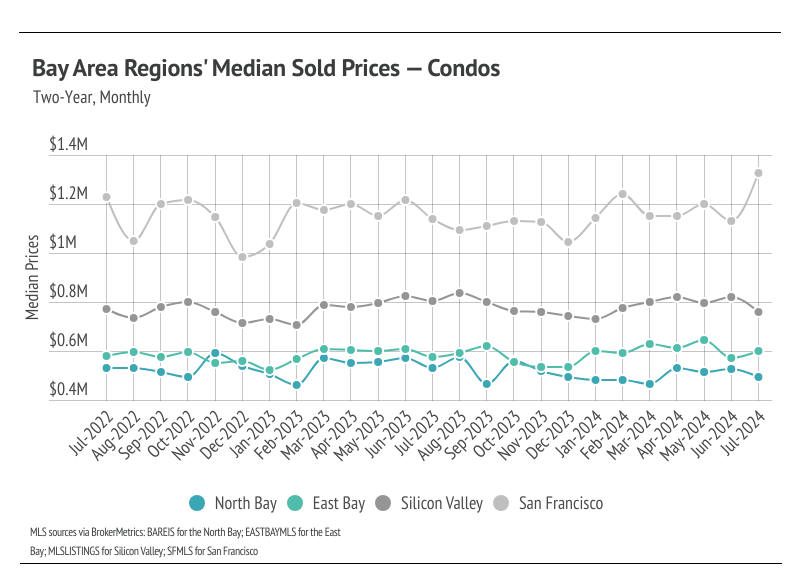
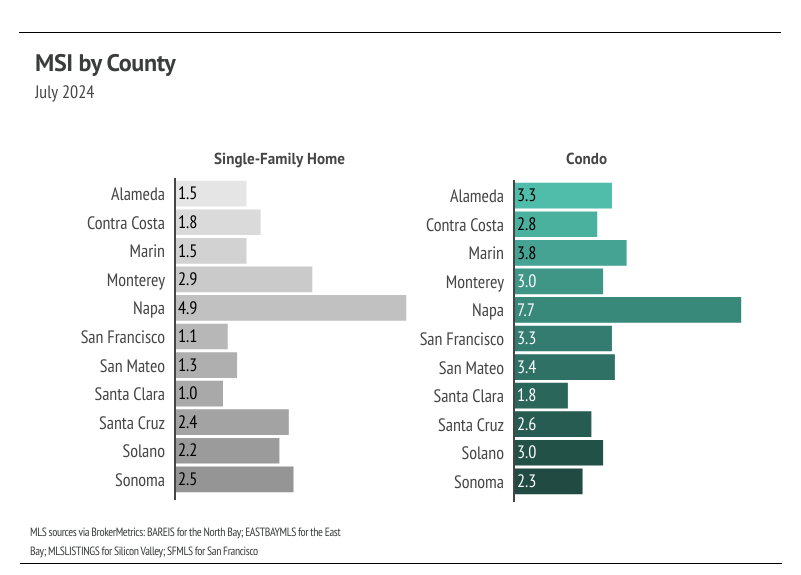
Months of Supply Inventory has remained below three months of supply for single-family homes, indicating a sellers’ market, with the exception of Napa. For condos, MSI has risen and now shows more balanced markets in the Bay Area.
Note: You can find the charts/graphs for the Local Lowdown at the end of this section.
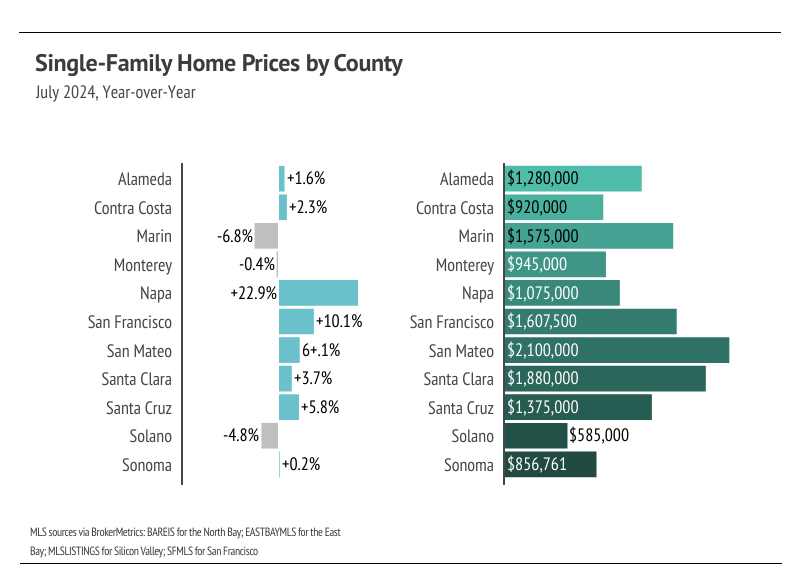
The median single-family home in Napa reached an all-time high
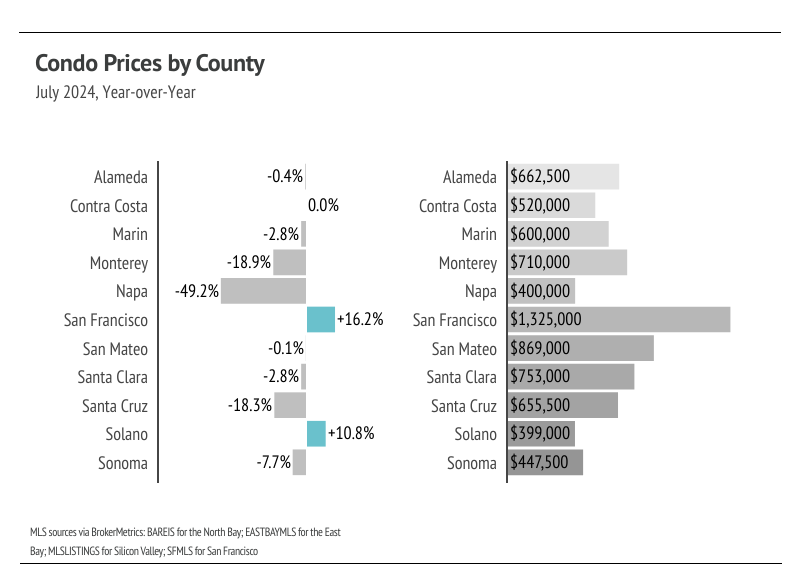
In the Bay Area, low inventory and high demand have more than offset the downward price pressure from higher mortgage rates. Prices in the Bay Area generally haven’t experienced larger drops due to higher mortgage rates, and as mentioned in the Big Story, higher mortgage rates are contributing to prices staying high. Year to date, in July, the median single-family home and condo prices rose across the Bay Area with the exception of condo prices in the North Bay, which are slightly lower. Year over year, prices increased most significantly for single-family homes in Napa and San Francisco, up 23% and 10%, respectively. Prices typically peak in the summer months, so we don’t expect new all-time highs for the rest of this year. However, we do expect some minor price contraction in the coming months. Additionally, demand is high enough that it will create price support as supply declines in the second half of the year.
High mortgage rates soften both supply and demand, but home buyers and sellers seemed to tolerate rates near 6%. Now that rates are declining again, sales could get a little boost, but the housing market typically begins to slow this time of year.
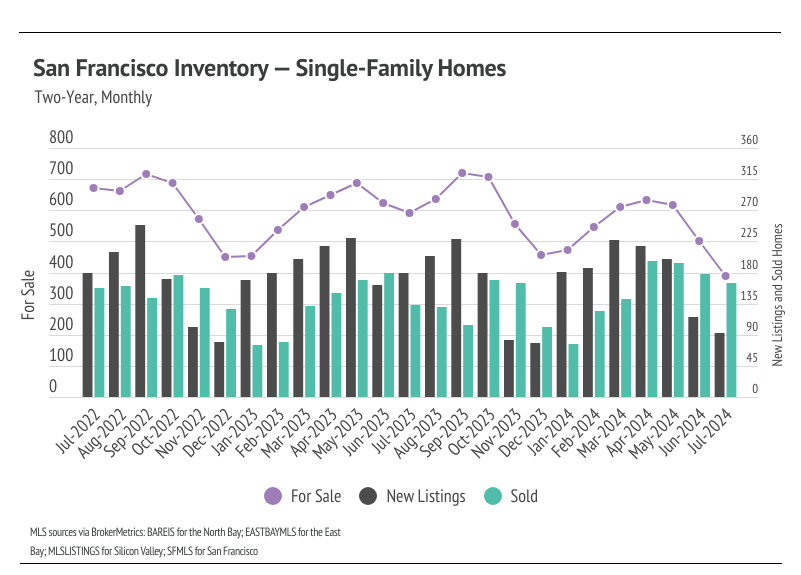
Sales fell slightly month over month — the seasonal norm
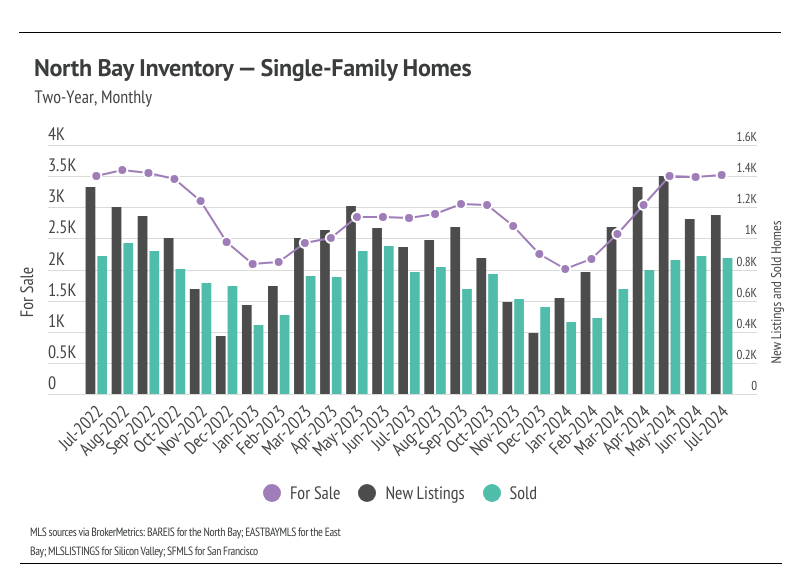
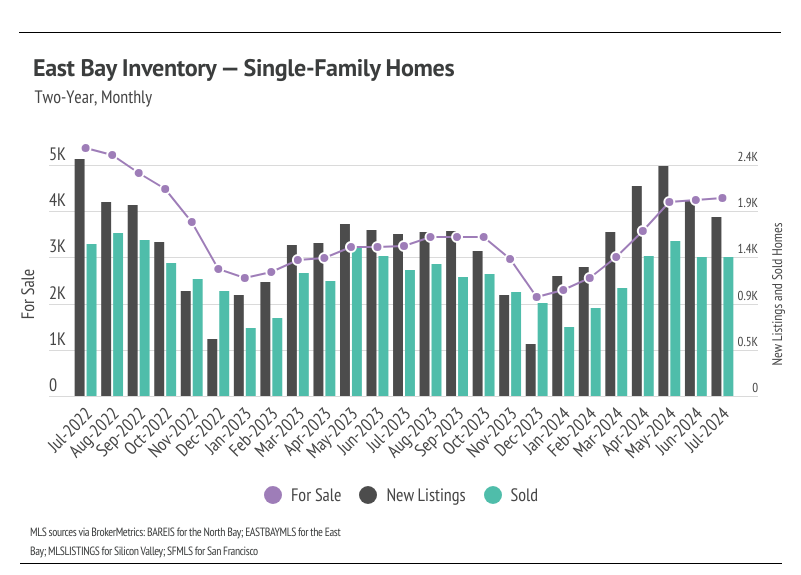
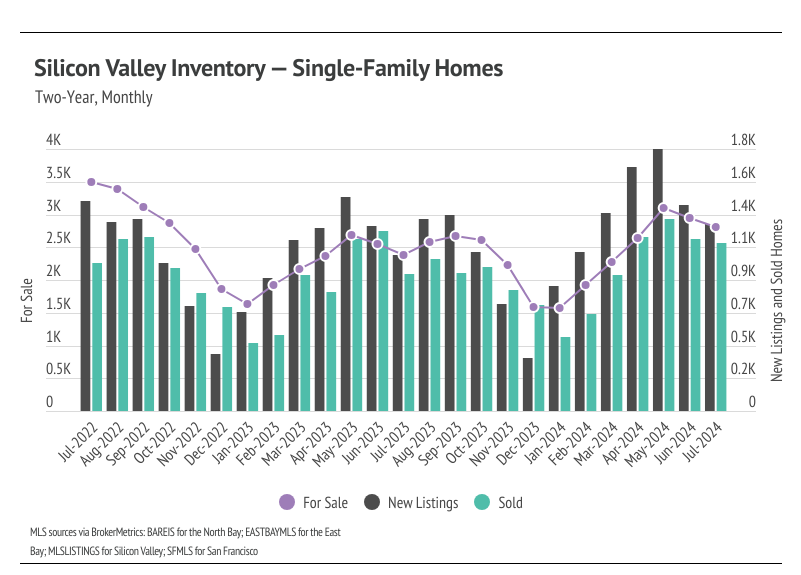
In most of the Bay Area, the housing market has looked progressively healthier with each passing month of 2024. We’re far enough into the year to know that inventory levels are about as good as we could’ve hoped in the North Bay, East Bay, and Silicon Valley. In 2023, single-family home inventory followed fairly typical seasonal trends, but at significantly depressed levels. Low inventory and fewer new listings slowed the market considerably last year. Even though sales volume this year was similar to last, far more new listings have come to the market, which has allowed inventory to grow. San Francisco is the major exception, with inventory reaching record lows in July. New listings in San Francisco have plummeted the last two months, and sales have far surpassed them.
Typically, inventory begins to increase in January or February, peaking in July or August before declining once again from the summer months to the winter. It’s looking like 2024 inventory, sales, and new listings will resemble historically seasonal patterns, and at more normal levels. Now that we’re more than halfway through the year, we expect inventory, sales, and new listings to decline through the rest of the year.
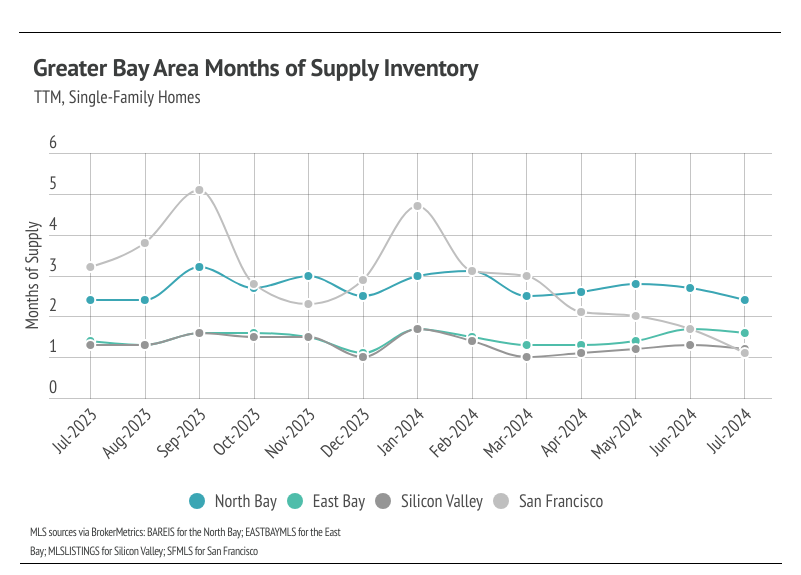
Months of Supply Inventory indicated a sellers’ market in most of the Bay Area
Months of Supply Inventory (MSI) quantifies the supply/demand relationship by measuring how many months it would take for all current homes listed on the market to sell at the current rate of sales. The long-term average MSI is around three months in California, which indicates a balanced market. An MSI lower than three indicates that there are more buyers than sellers on the market (meaning it’s a sellers’ market), while a higher MSI indicates there are more sellers than buyers (meaning it’s a buyers’ market). The Bay Area markets tend to favor sellers, which is reflected in their low MSIs. San Francisco MSI is notable for its variability over the past year, oscillating from buyers’ to sellers’ markets twice over the course of 12 months. Currently, MSI is below three months of supply (a sellers’ market) in every Bay Area county, except for single-family homes in Napa, which favor buyers, and condos in the North Bay, East Bay, and San Francisco, which are now balanced.
Local Lowdown Data