Rising Rates Shape a Cooling Housing Market

November 26, 2024

Monthly Market Update

Greater Bay Area market update over an aerial view of the shoreline and city.

The Big Story

Sellers are coming back to the market

Quick Take:
  • After the election of Donald J. Trump, bond prices increased in anticipation of his inflationary policy positions. Interest rates are the most significant factor financially in purchasing a home for most buyers, and as we’ve seen over the past two years, higher rates translate to lower sales.
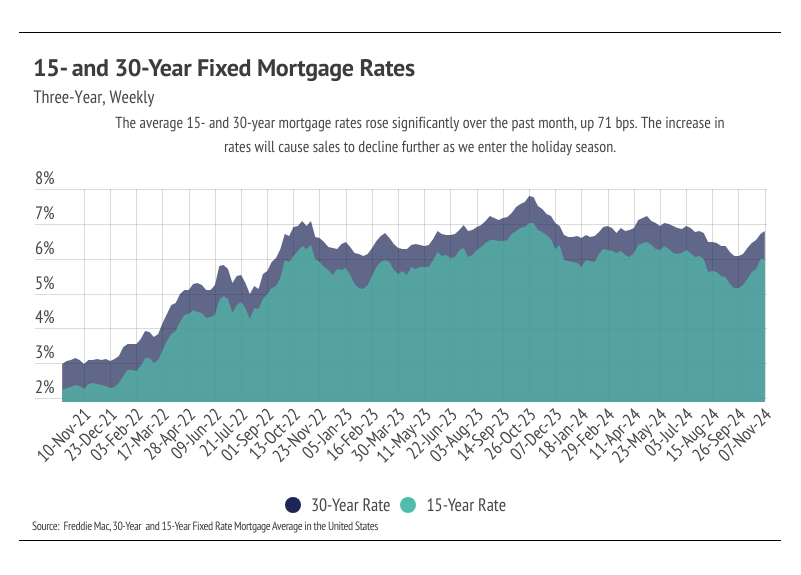
  • From October 1 – November 7, the average 30-year mortgage rate rose 71bps, landing at 6.79%. The Fed cut rates by 50 bps in September and another 25 bps during the Fed’s November 6-7 meeting.
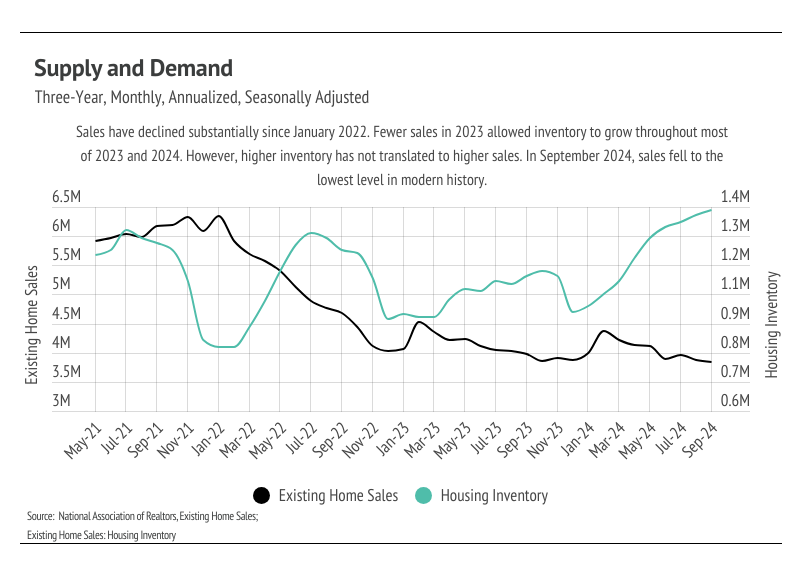
  • Sales declined 1.0% month over month, falling to the lowest level in modern history, while inventory rose to its highest level since 2020. The spike in mortgage rates should further slow the market in the winter months.

Bond and mortgage rates are risings as the Fed is cutting rates

Let’s talk about rates. The benchmark 10-year Treasury rate rose by as much as 18 basis points the day after the election, pushing the overall rate on the bond to 4.47%. The price of bonds and their yield move inversely, with prices falling as rates rise. For example, if you have a $100 bond paying 10% and then rates rise to 20%, the original $100 at 10% becomes less valuable because now investors could get a $100 bond that pays 20%. A rising yield on Treasury bonds raises the cost of the U.S. federal government when it borrows new money or rolls over existing debts. In short, the cost of borrowing increases and, therefore, more money is needed to pay interest rather than paying for tangible government programs. The 30-year mortgage rate trends with the 10-year Treasury rate, usually about 2% higher. As of November 7, 2024, the average 30-year mortgage rate was 6.79%, a significant increase from 6.08% at the end of September. In just over a month’s time, the monthly payment on a $500,000 loan increased 7.7%.
 
But the question you may be asking is, why did rates go up even in the wake of the Fed cutting the federal funds rate? Real interest rate returns account for inflation, so the $100 bond at the nominal rate of 10% can be rewritten as 10% minus inflation (currently 2.4%) to get the real return of the investment. If inflation is expected to rise, the nominal rate can increase, so real return is unaffected or, at least, less affected,, in which case real return would decrease. Trump’s economic plans are inflationary and, therefore, increase rates. The U.S. economy is operating at close to capacity, and unemployment is low. Tax cuts will increase demand, but higher tariffs will push up prices. The U.S. is a net importer, so blanket tariffs will drive up the prices of an incredible number of day-to-day goods. Higher inflation will result, meaning the Federal Reserve will be more cautious about cutting interest rates.
 
Currently, mortgage rates rise higher when the housing market already tends to slow. Typically, the holiday season experiences fewer sales then picks up again in January. A month ago, rates were dropping, and we were extremely bullish on the spring market. However, if rates rise above 7% or higher, the market will be slower than usual. Since the market has already been slower than usual, a further slowdown coupled with higher inflation would likely slow price growth next year.
 
Different regions and individual houses vary from the broad national trends, so we’ve included a Local Lowdown below to provide you with in-depth coverage for your area. As always, we will continue to monitor the housing and economic markets to best guide you in buying or selling your home.
 

Big Story Data

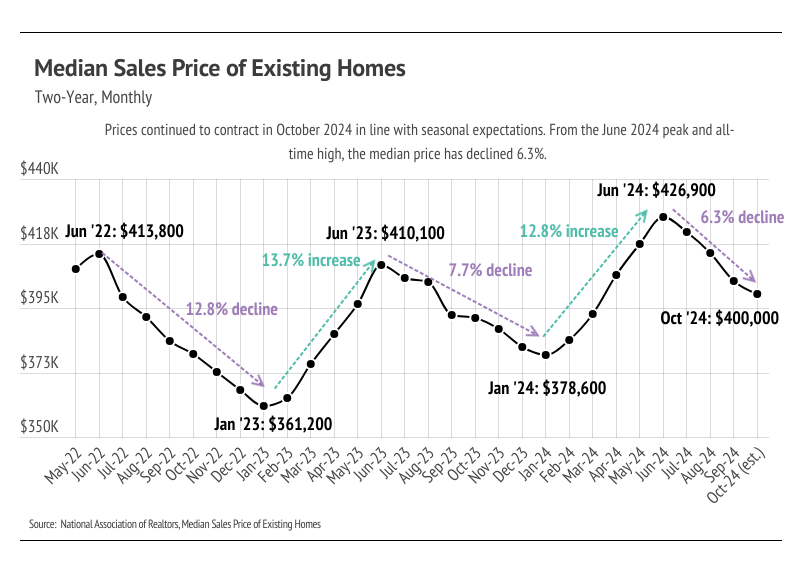
Line chart of existing-home median prices, peaking at $426,900 in June 2024 before declining to $400,000 in October.
Chart comparing weekly 15- and 30-year fixed mortgage rates from November 2021 to November 2024.
Line chart showing declining existing home sales and rising housing inventory from 2021 through September 2024.
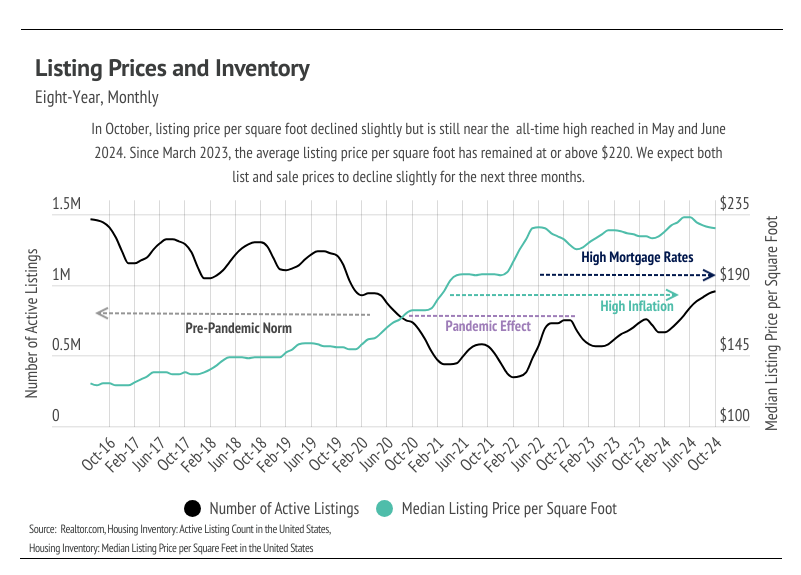
Chart comparing active listings and median listing prices per square foot from 2016 to 2024, with annotations on market trends.
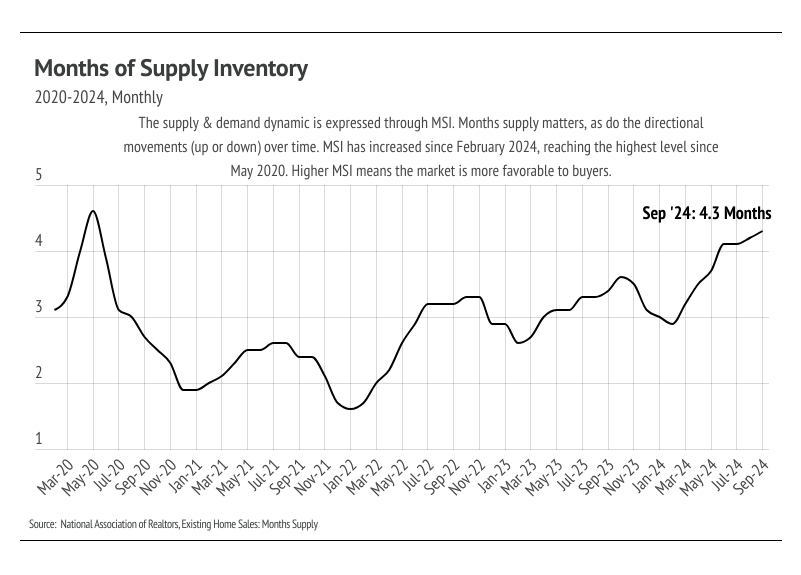
Line chart of housing supply from 2020 to 2024, rising to 4.3 months in September 2024.

The Local Lowdown

Quick Take:
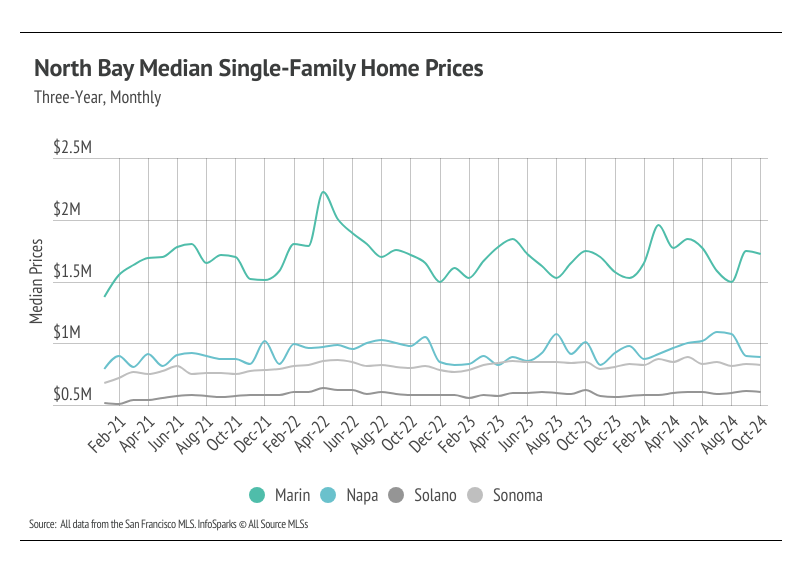
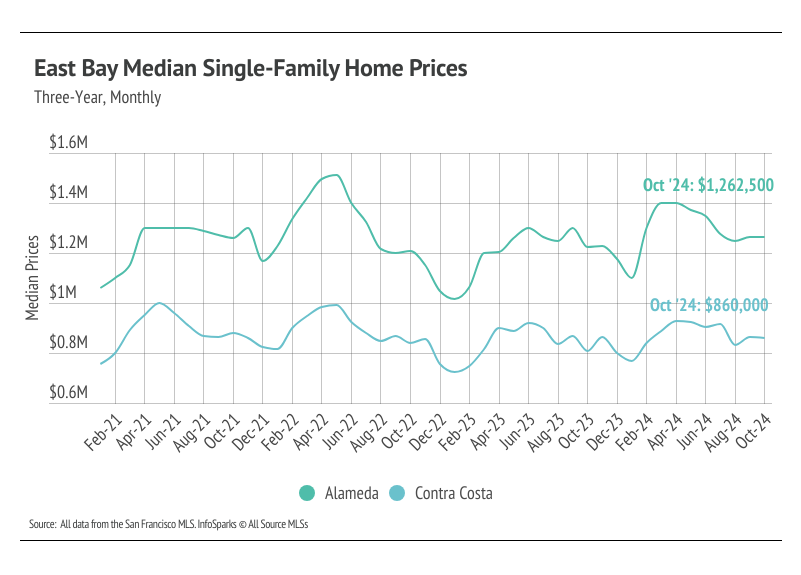
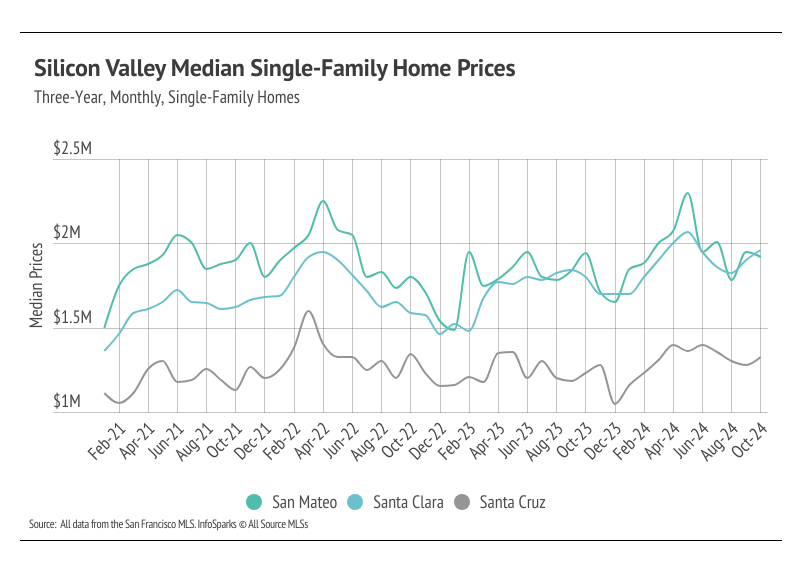
  • Median prices rose in Silicon Valley and San Francisco, while prices in the North and East Bay declined. Typically, prices contract this time of year, highlighting the outsized effect mortgage rates have on the market.
  • Total inventory in the Bay Area declined, as sales increased and fewer new listings came to the market. However, we expect inventory to decline and the overall market to slow over the next three months.
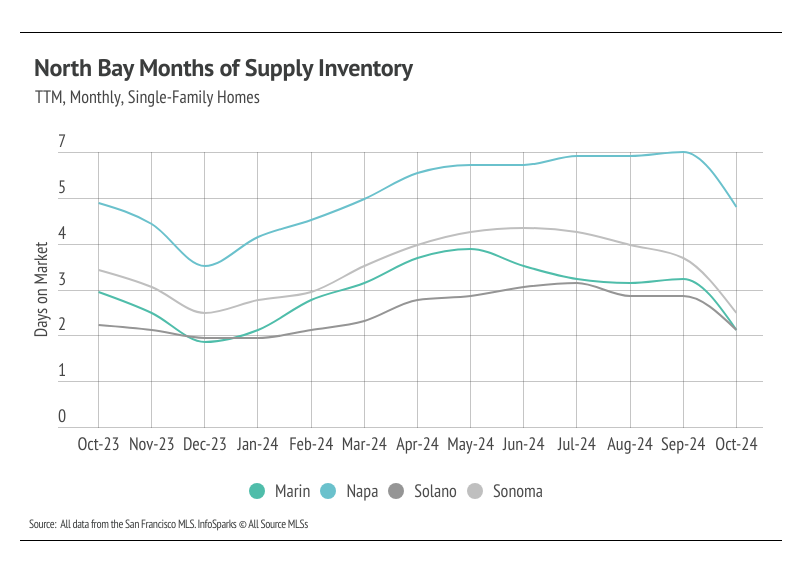
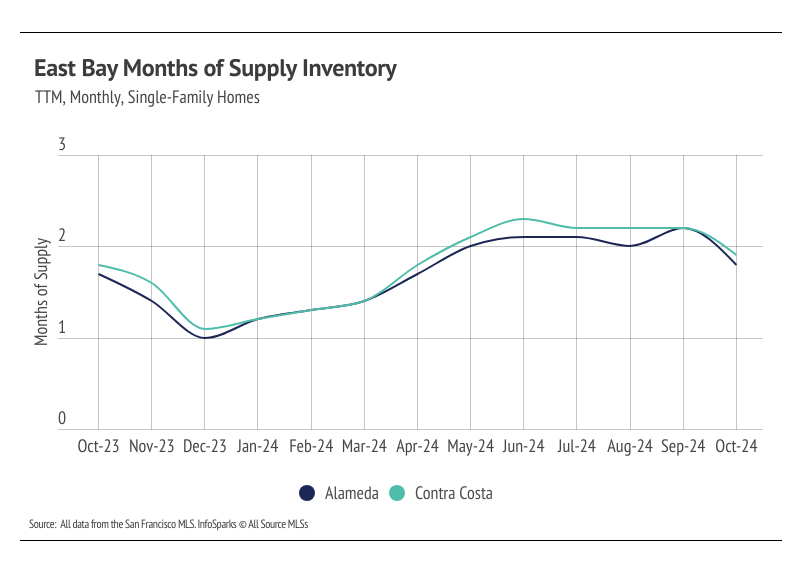
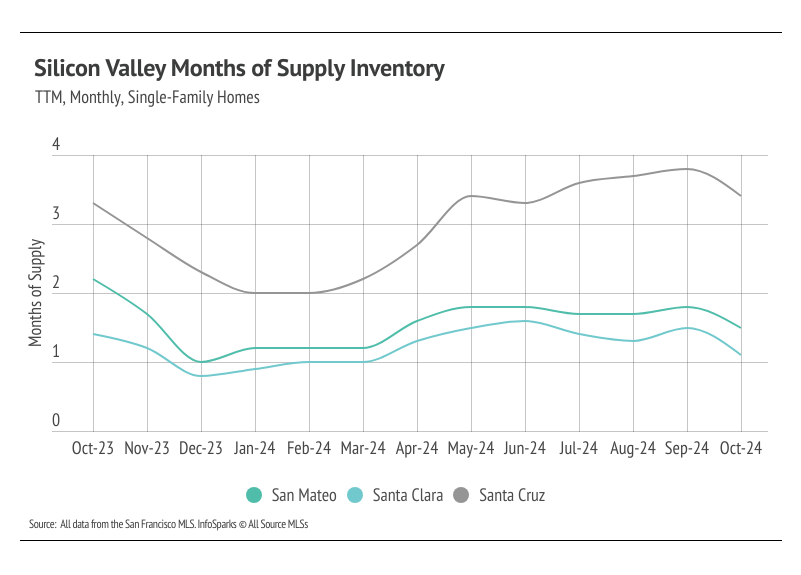
  • Months of Supply Inventory has remained below three months of supply for single-family homes, indicating a sellers’ market, with the exception of Napa and Santa Cruz, which favor buyers.

Median prices rose in Silicon Valley and San Francisco as sales increased

 
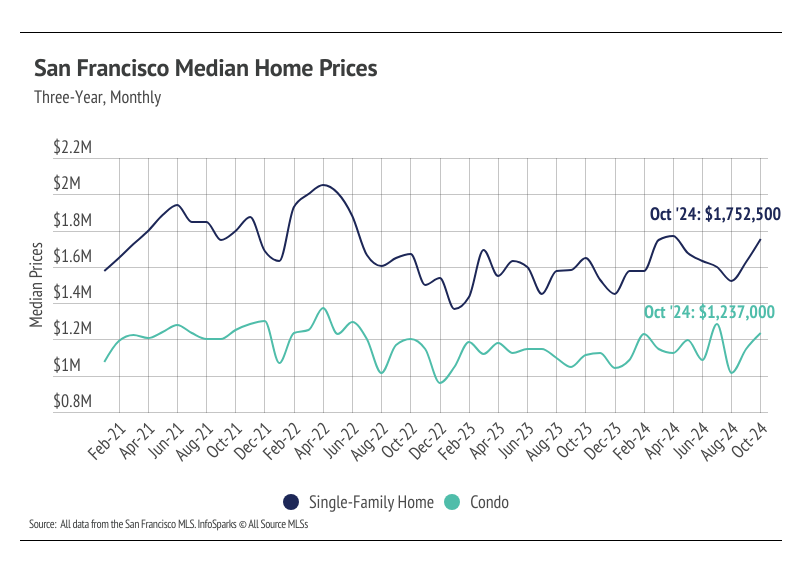
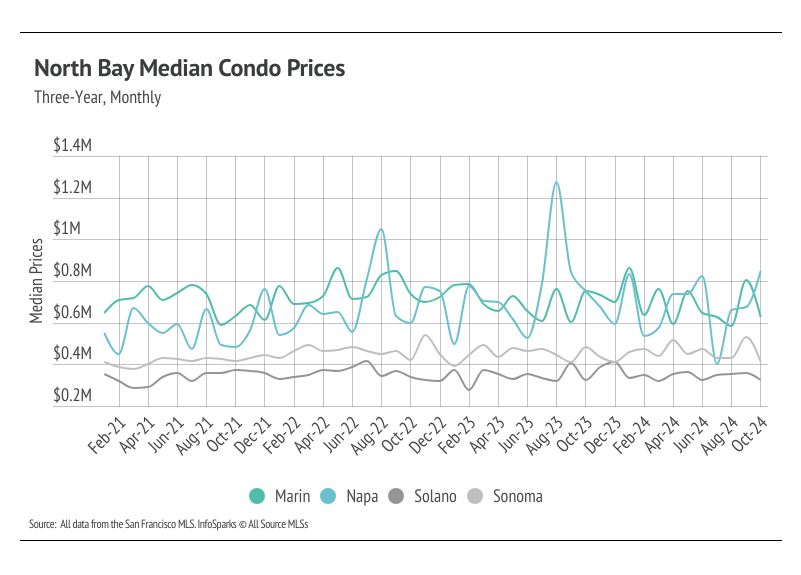
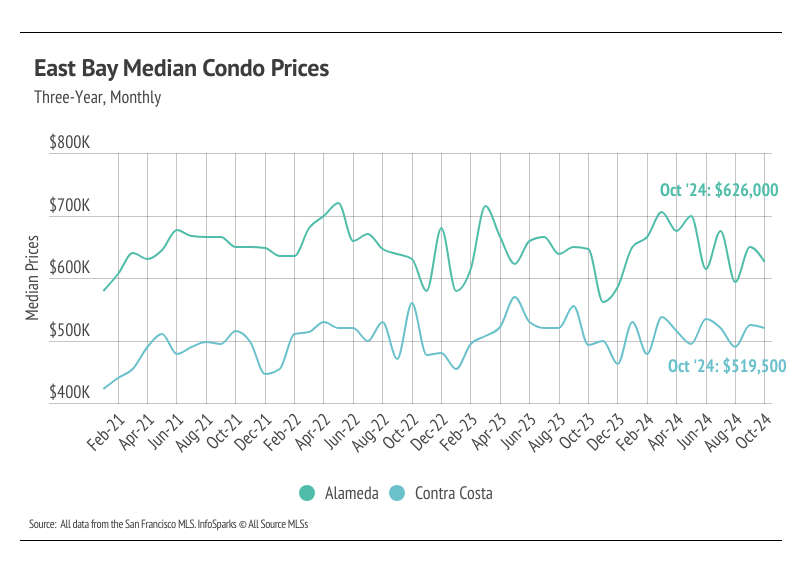
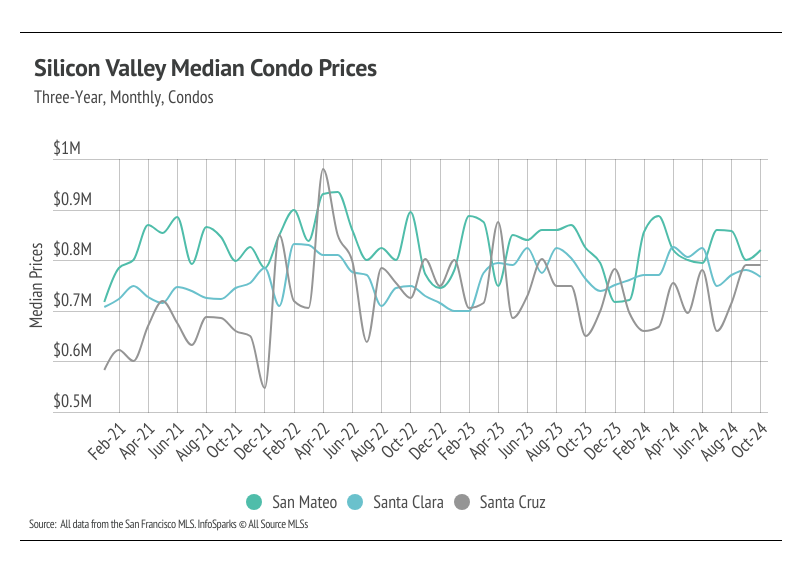
In the Bay Area, home prices haven’t been largely affected by rising mortgage rates after the initial period of price correction from April 2022 to January 2023. Low, but growing, inventory and high demand have more than offset the downward price pressure from higher mortgage rates. Year to date, in October, the median single-family home and condo prices rose across the Bay Area with the exception of single-family homes in Napa, and condos in Marin and Sonoma, which are slightly lower. Year over year, prices increased most significantly for single-family homes in Silicon Valley and San Francisco. Prices typically peak in the summer months, so we expect some minor price contraction through January 2025.
 
High mortgage rates soften both supply and demand, but home buyers and sellers seemed to tolerate rates near 6% much more than around 7%. Mortgage rates fell significantly from May through September, but rose significantly in October. Now, rates are far closer to 7% than 6%, so we expect sales to slow starting in November.
 

Sales rose across the Bay Area, while new listings and inventory declined

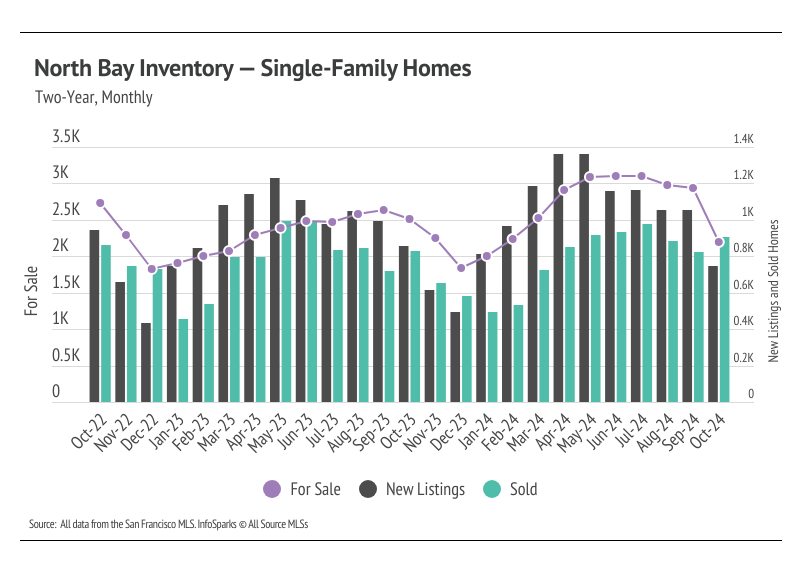
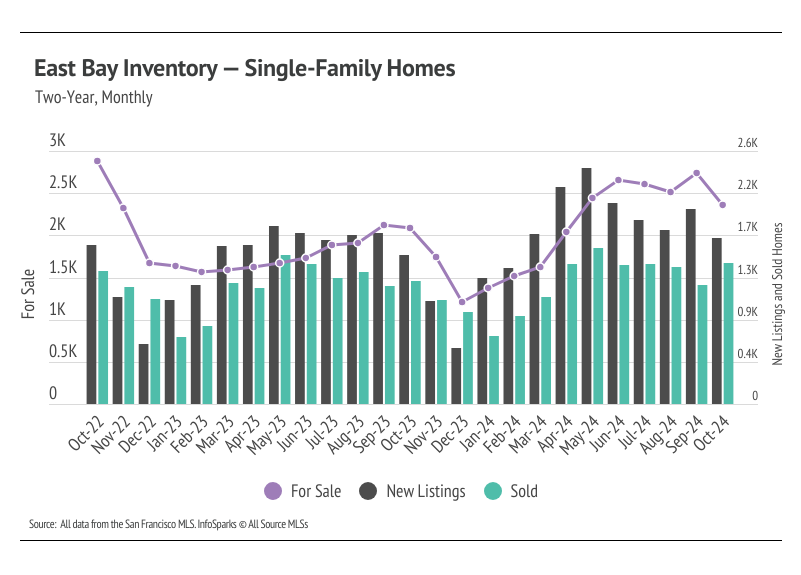
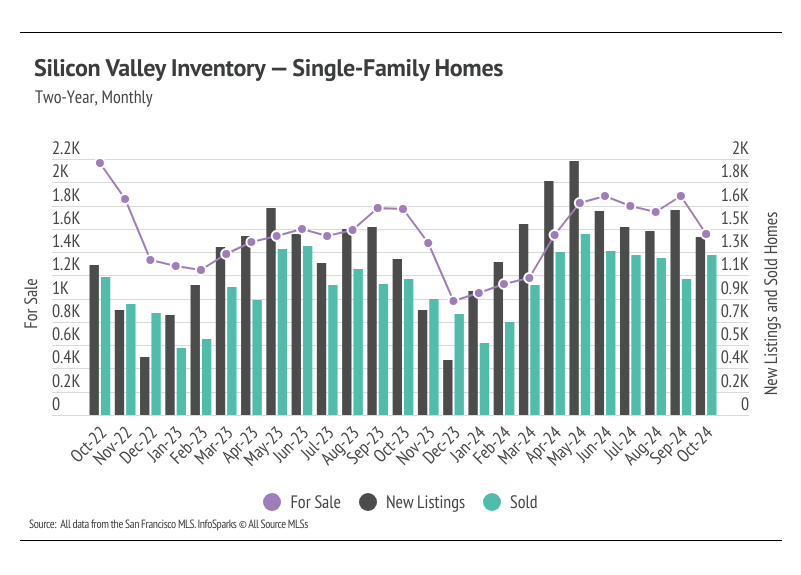
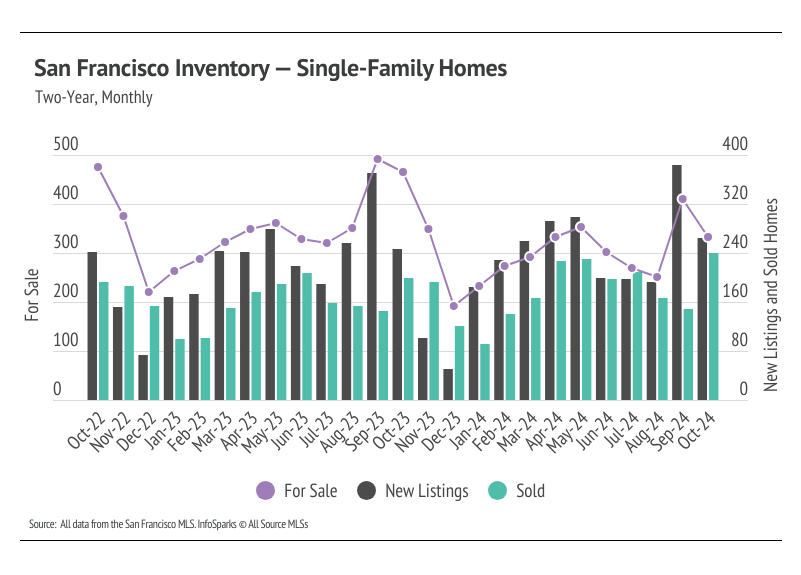
In most of the Bay Area, the housing market has looked progressively healthier with each passing month of 2024. We’re far enough into the year to know that inventory levels are about as good as we could’ve hoped in the North Bay, East Bay, and Silicon Valley. In 2023, single-family home inventory followed fairly typical seasonal trends, but at significantly depressed levels. Low inventory and fewer new listings slowed the market considerably last year. Even though sales volume this year was similar to last, far more new listings have come to the market, which has allowed inventory to grow. In San Francisco specifically, a significant number of new listings tend to hit the market in January and September in any given year, so new listings aren’t unexpected in September. Sales rose across the Bay Area, but San Francisco sales were particularly notable, up 50% month over month.
 
Typically, inventory begins to increase in January or February, peaking in July or August before declining once again from the summer months to the winter. It’s looking like 2024 inventory, sales, and new listings will resemble historically seasonal patterns, and at more normal levels than last year. Falling mortgage rates have brought buyers and sellers back to the market during the time of year the market tends to slow significantly. Sales and homes under contract rose in October, which is fairly normal from a historical standpoint. We expect sales to slow over the next three months.
 

Months of Supply Inventory indicated a sellers’ market in most of the Bay Area

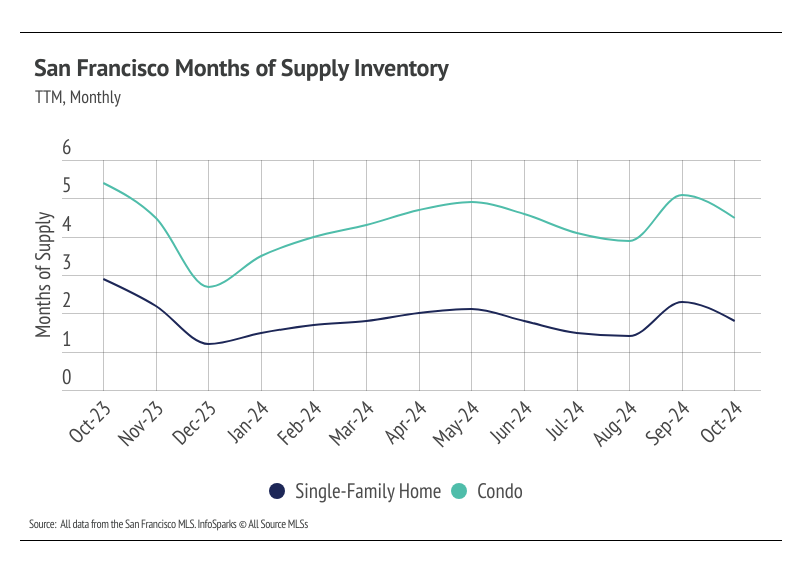
Months of Supply Inventory (MSI) quantifies the supply/demand relationship by measuring how many months it would take for all current homes listed on the market to sell at the current rate of sales. The long-term average MSI is around three months in California, which indicates a balanced market. An MSI lower than three indicates that there are more buyers than sellers on the market (meaning it’s a sellers’ market), while a higher MSI indicates there are more sellers than buyers (meaning it’s a buyers’ market). The Bay Area markets tend to favor sellers, which is reflected in their low MSIs. Currently, MSI is below three months of supply (a sellers’ market) in every Bay Area county, except for single-family homes in Napa and Santa Cruz, which favor buyers.
 

Local Lowdown Data

Line chart comparing monthly median single-family home prices in Marin, Napa, Solano, and Sonoma counties.
Line chart comparing East Bay median single-family home prices; October 2024: Alameda $1,262,500, Contra Costa $860,000.
Line chart comparing monthly single-family home prices in San Mateo, Santa Clara, and Santa Cruz counties, 2021–2024.
San Francisco median home prices chart, comparing monthly single-family home and condo prices through October 2024.
Line chart of monthly median condo prices in four North Bay counties, February 2021 to October 2024.
Chart of East Bay monthly median condo prices, comparing Alameda and Contra Costa counties through October 2024.
Line chart comparing monthly median condo prices in San Mateo, Santa Clara, and Santa Cruz counties, February 2021–October 2024.
North Bay single-family home inventory chart comparing for-sale, new-listing, and sold counts from October 2022 to October 2024.
East Bay single-family home inventory chart comparing for-sale listings, new listings, and sold homes from October 2022 to October 2024.
Chart of Silicon Valley single-family home inventory, with monthly for-sale, new-listing, and sold figures from October 2022 to October 2024.
Chart of San Francisco single-family home inventory, new listings, and sales by month from October 2022 to October 2024.
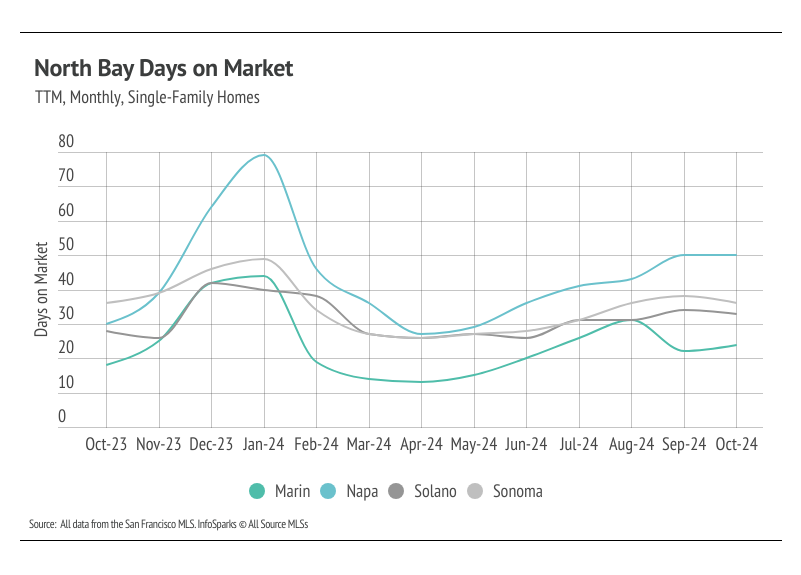
Line chart of North Bay days on market, October 2023–October 2024; Napa peaks in January while Marin dips in spring.
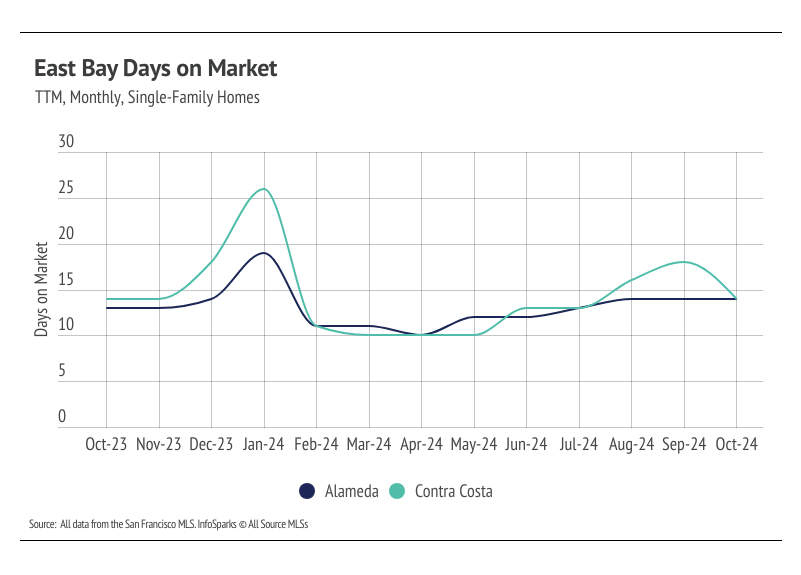
Line chart comparing monthly days on market for Alameda and Contra Costa single-family homes, October 2023–October 2024.
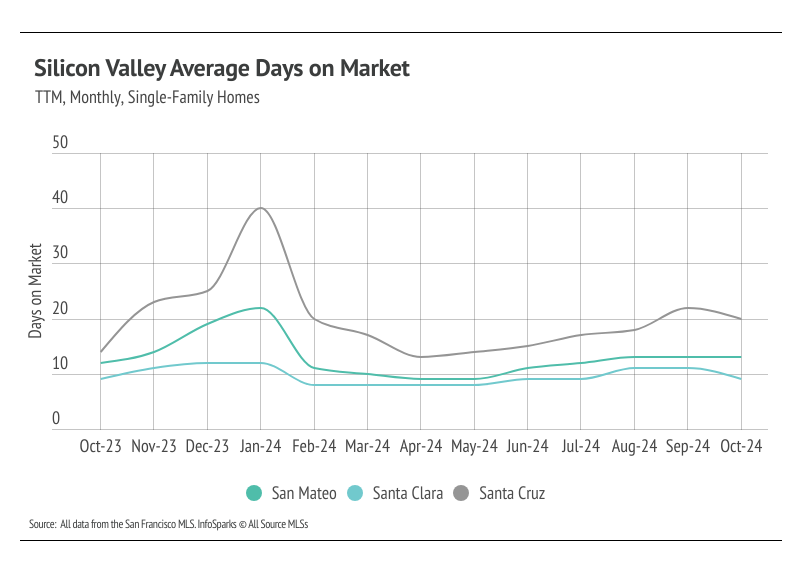
Line chart comparing monthly days on market for single-family homes in San Mateo, Santa Clara, and Santa Cruz, October 2023–October 2024.
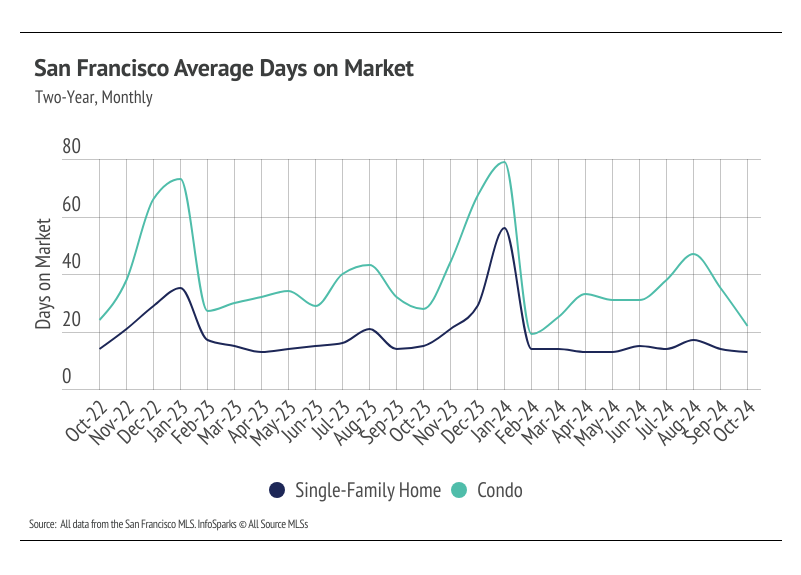
Chart comparing monthly days on market for San Francisco single-family homes and condos, October 2022 to October 2024.
Line chart of monthly single-family home supply in four North Bay counties, October 2023–October 2024.
East Bay months of supply chart comparing Alameda and Contra Costa from October 2023 to October 2024.
Line chart comparing monthly single-family home supply in San Mateo, Santa Clara, and Santa Cruz counties, October 2023–October 2024.
San Francisco months of supply chart comparing single-family homes and condos from October 2023 to October 2024.


Recent Blog Posts

Stay up to date on the latest real estate trends.

South City neighborhood feature graphic titled “What It’s Actually Like to Call South City Home.”
7 Smart Improvements That Add Real Value to Your Home in San Mateo County

November 9, 2026

What I'd actually put money into before selling, and what can wait

Client story: When the Market Says No: A Short Sale Story
When the Market Says No: A Short Sale Story About Patience and Honest Options

October 31, 2026

What one seller’s short sale taught me about patience, preparation, and giving people the full picture

Client story: The Sale Nobody Wants to Talk About, over an aerial highway view.
When the Market Says No: A Short Sale Story About Patience and Honest Options

October 24, 2026

What one seller’s short sale taught me about patience, preparation, and giving people the full picture

Client story: From a Paused Search to a Brand New Home.
From a Paused Search to a Brand New Home

October 16, 2026

How one referred family took a break, came back with a new plan, and found their fresh start

Client story: An Off-Market Home in Stockton.
An Off-Market First Home in Stockton: What It Taught Me

October 9, 2026

A first-time buyer's story about trust, relationships, and homes that aren’t publicly listed

Investor guide: Your First Investment in Daly City
How to Buy Your First Investment Property in Daly City

October 3, 2026

A step-by-step guide to real estate investing in Daly City, from running the numbers to knowing what the local rules actually allow

Client story: The San Bruno Fixer Sold Before We Met
The San Bruno Fixer That Sold Before We Ever Met in Person

September 26, 2026

How an inherited family home, rented for more than 20 years, found the right buyer at a price that worked for my seller

Hayward vs. Richmond East Bay comparison guide
Hayward vs. Richmond: Which East Bay City Gives You More for Your Money?

September 17, 2026

A side-by-side look at home prices, rent, taxes, utilities, schools, and everyday life in two popular East Bay alternatives to San Francisco and the Peninsula

Real estate guide: “What to Know This Indian Summer,” by Guillean Arradaza | Kinetic Real Estate.
Is Now a Good Time to Buy or Sell in the Bay Area? Here's What to Know This Indian Summer

September 12, 2026

A straight look at Peninsula pricing, rates, and seasonal timing as of September 2026, plus what I'd tell you if you were sitting across from me.

Let's Talk

You’ve got questions and we can’t wait to answer them.