Inventory Surge & Lower Payments: What This Means for Your Next Move

April 17, 2025

Market Update

Greater Bay Area market update over an aerial view of the shoreline and city.

The Big Story

Quick Take:

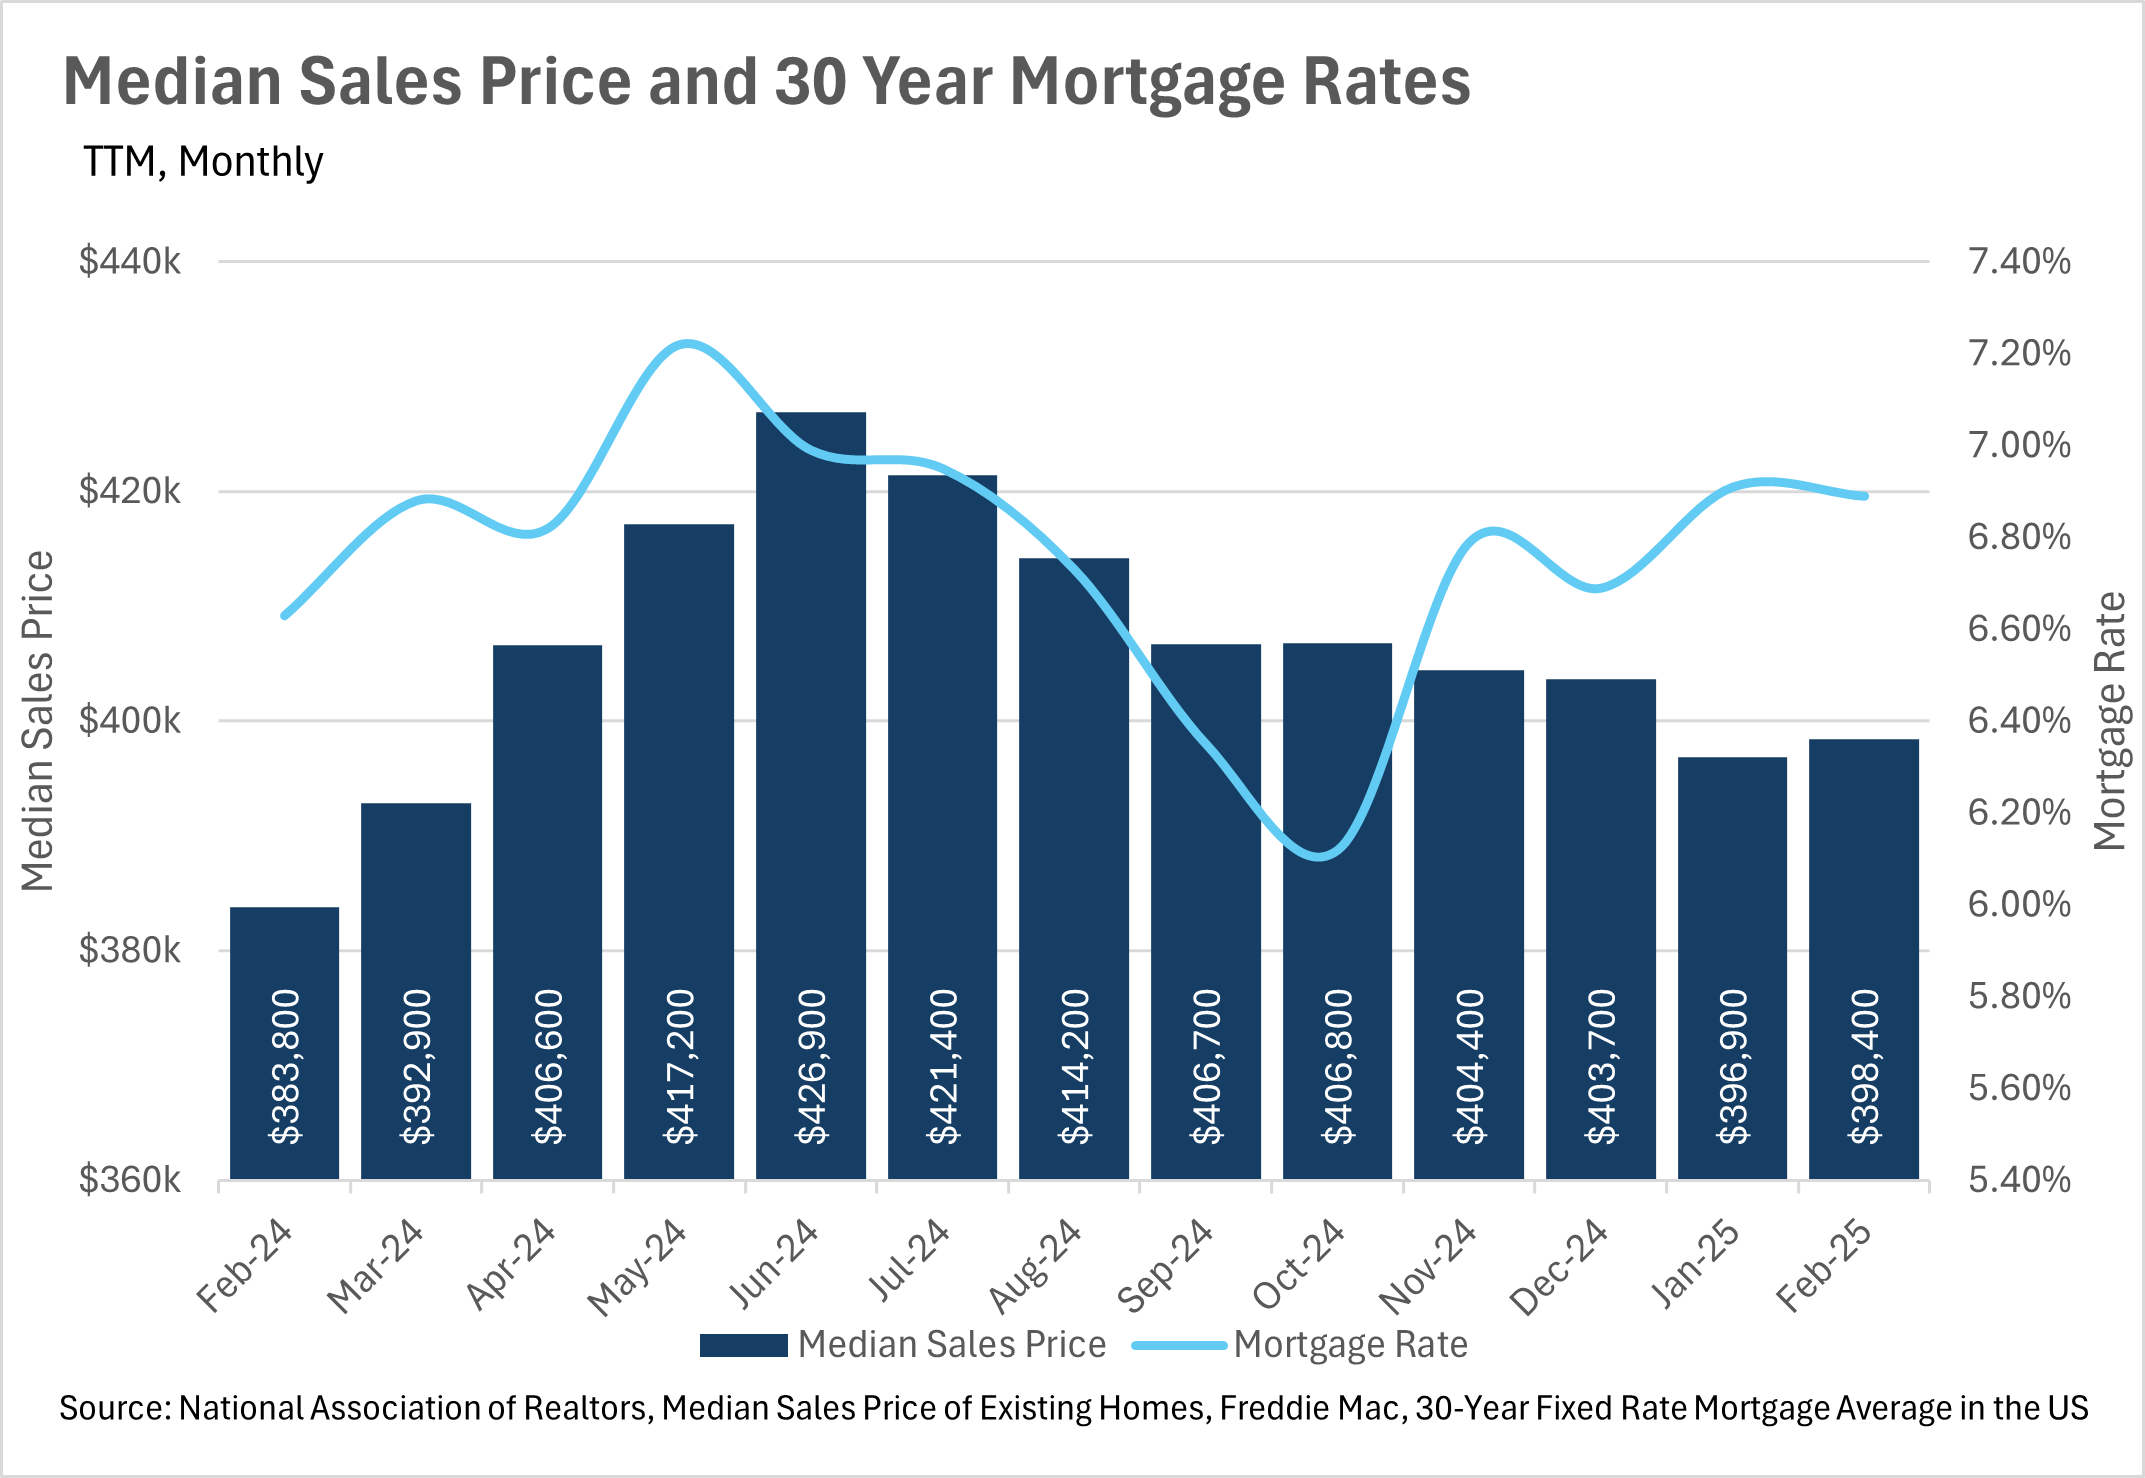
  • Mortgage rates have ticked up slightly over the course of the past year, and coincidentally, so has the median sale price of a home in the US.
  • According to Freddie Mac, the average 30-year mortgage rate is 6.62%, as of April 10th.
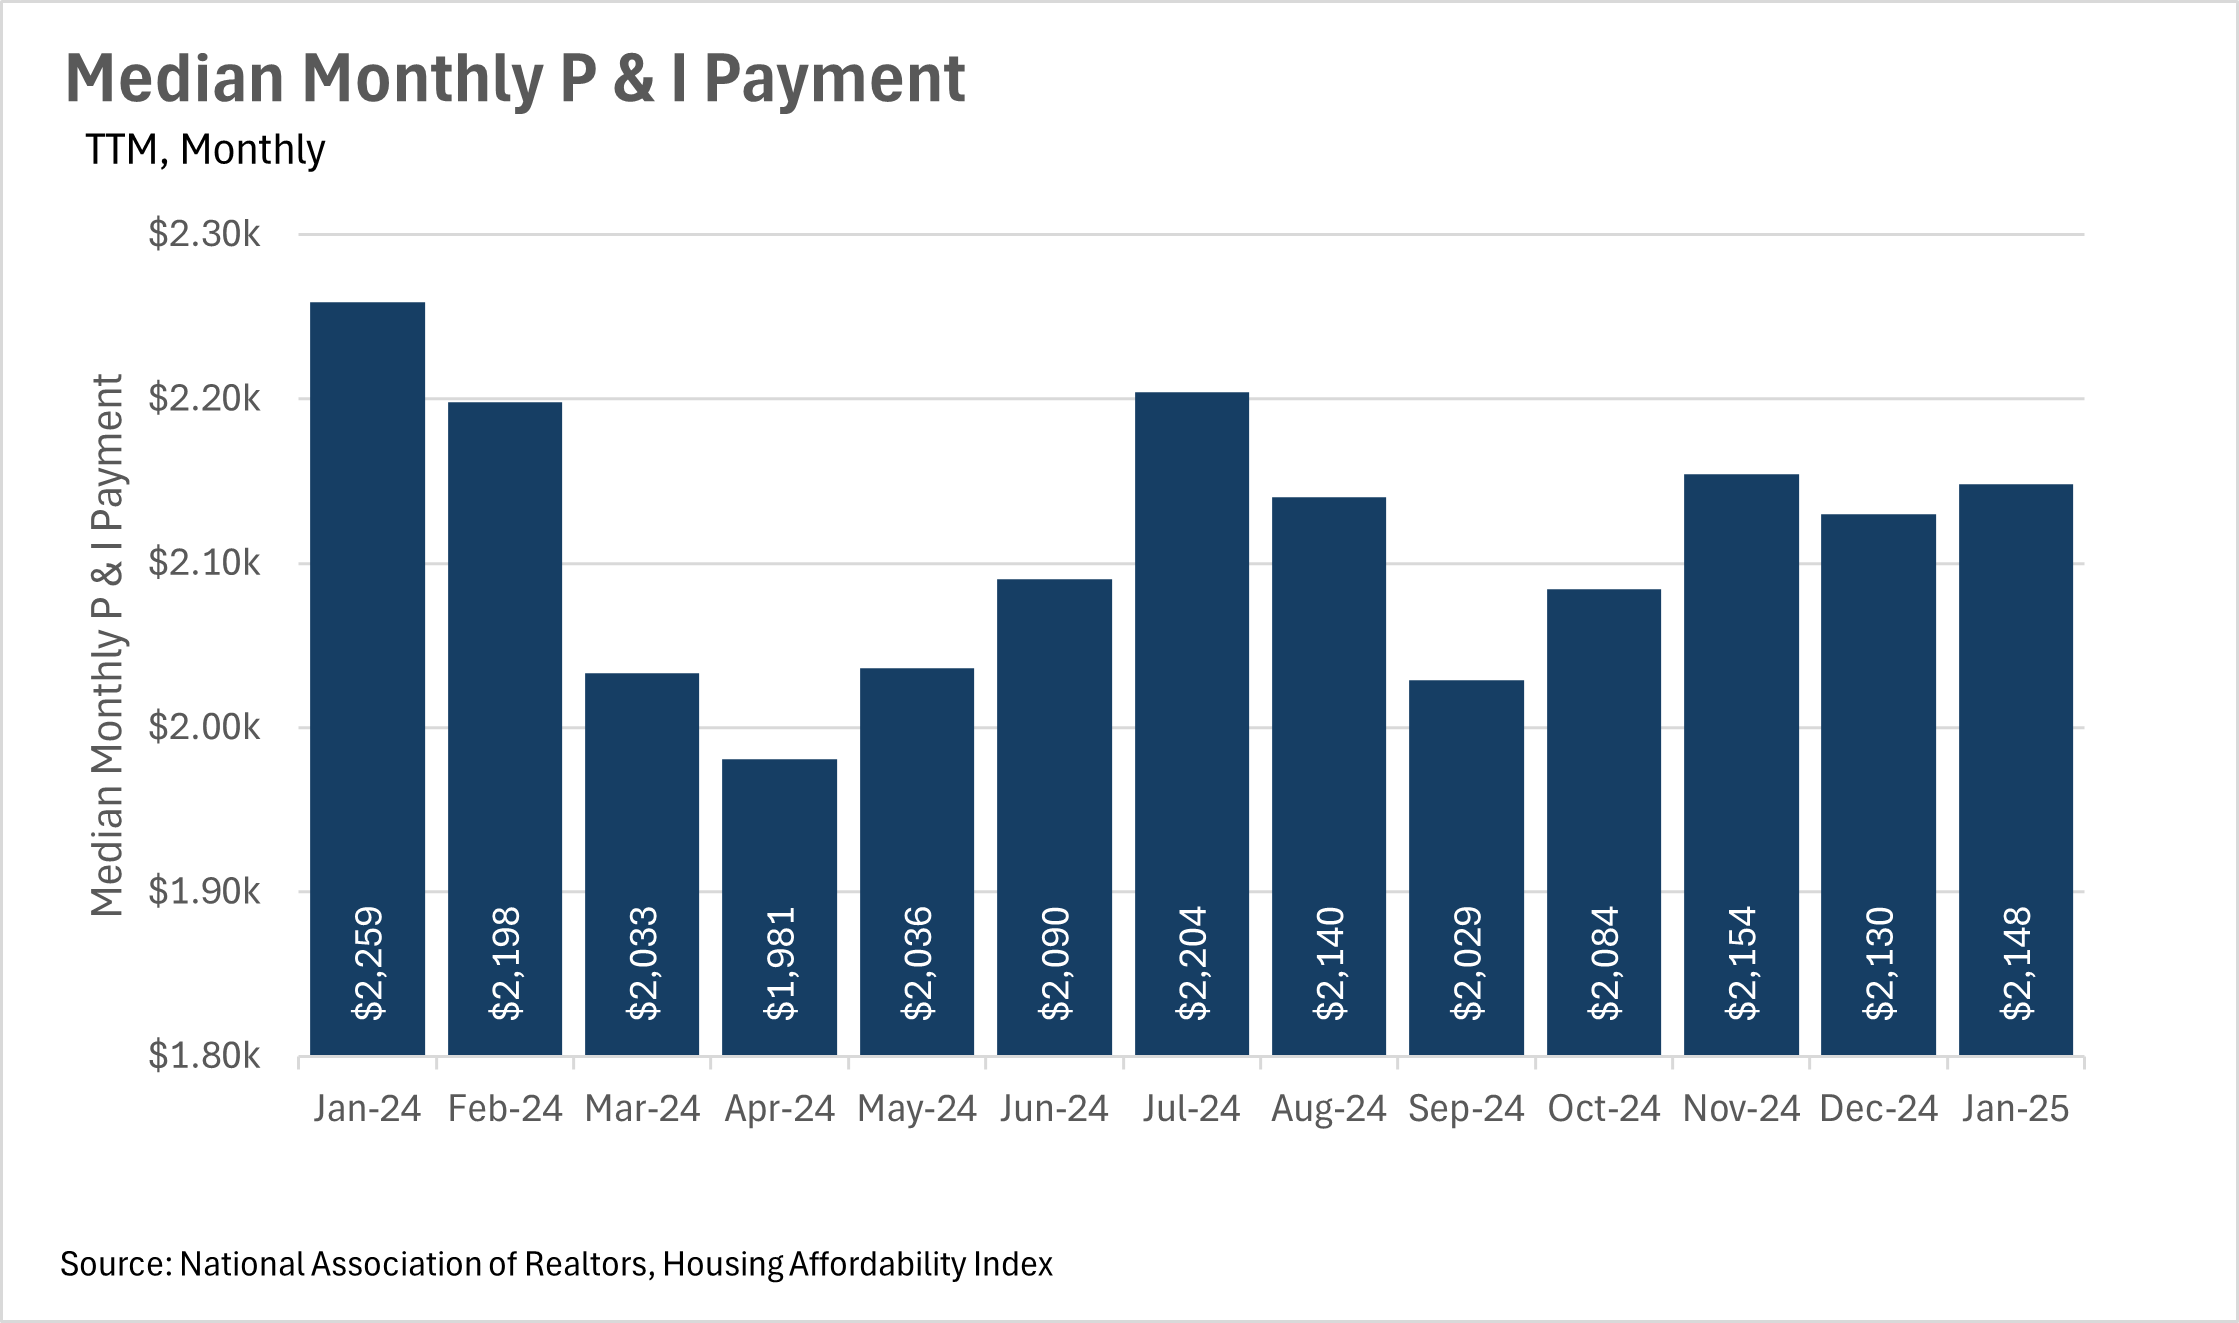
  • Although affordability remains an issue throughout the country, the median monthly P&I payment has declined by over $100 year over year, representing a considerable savings for consumers!
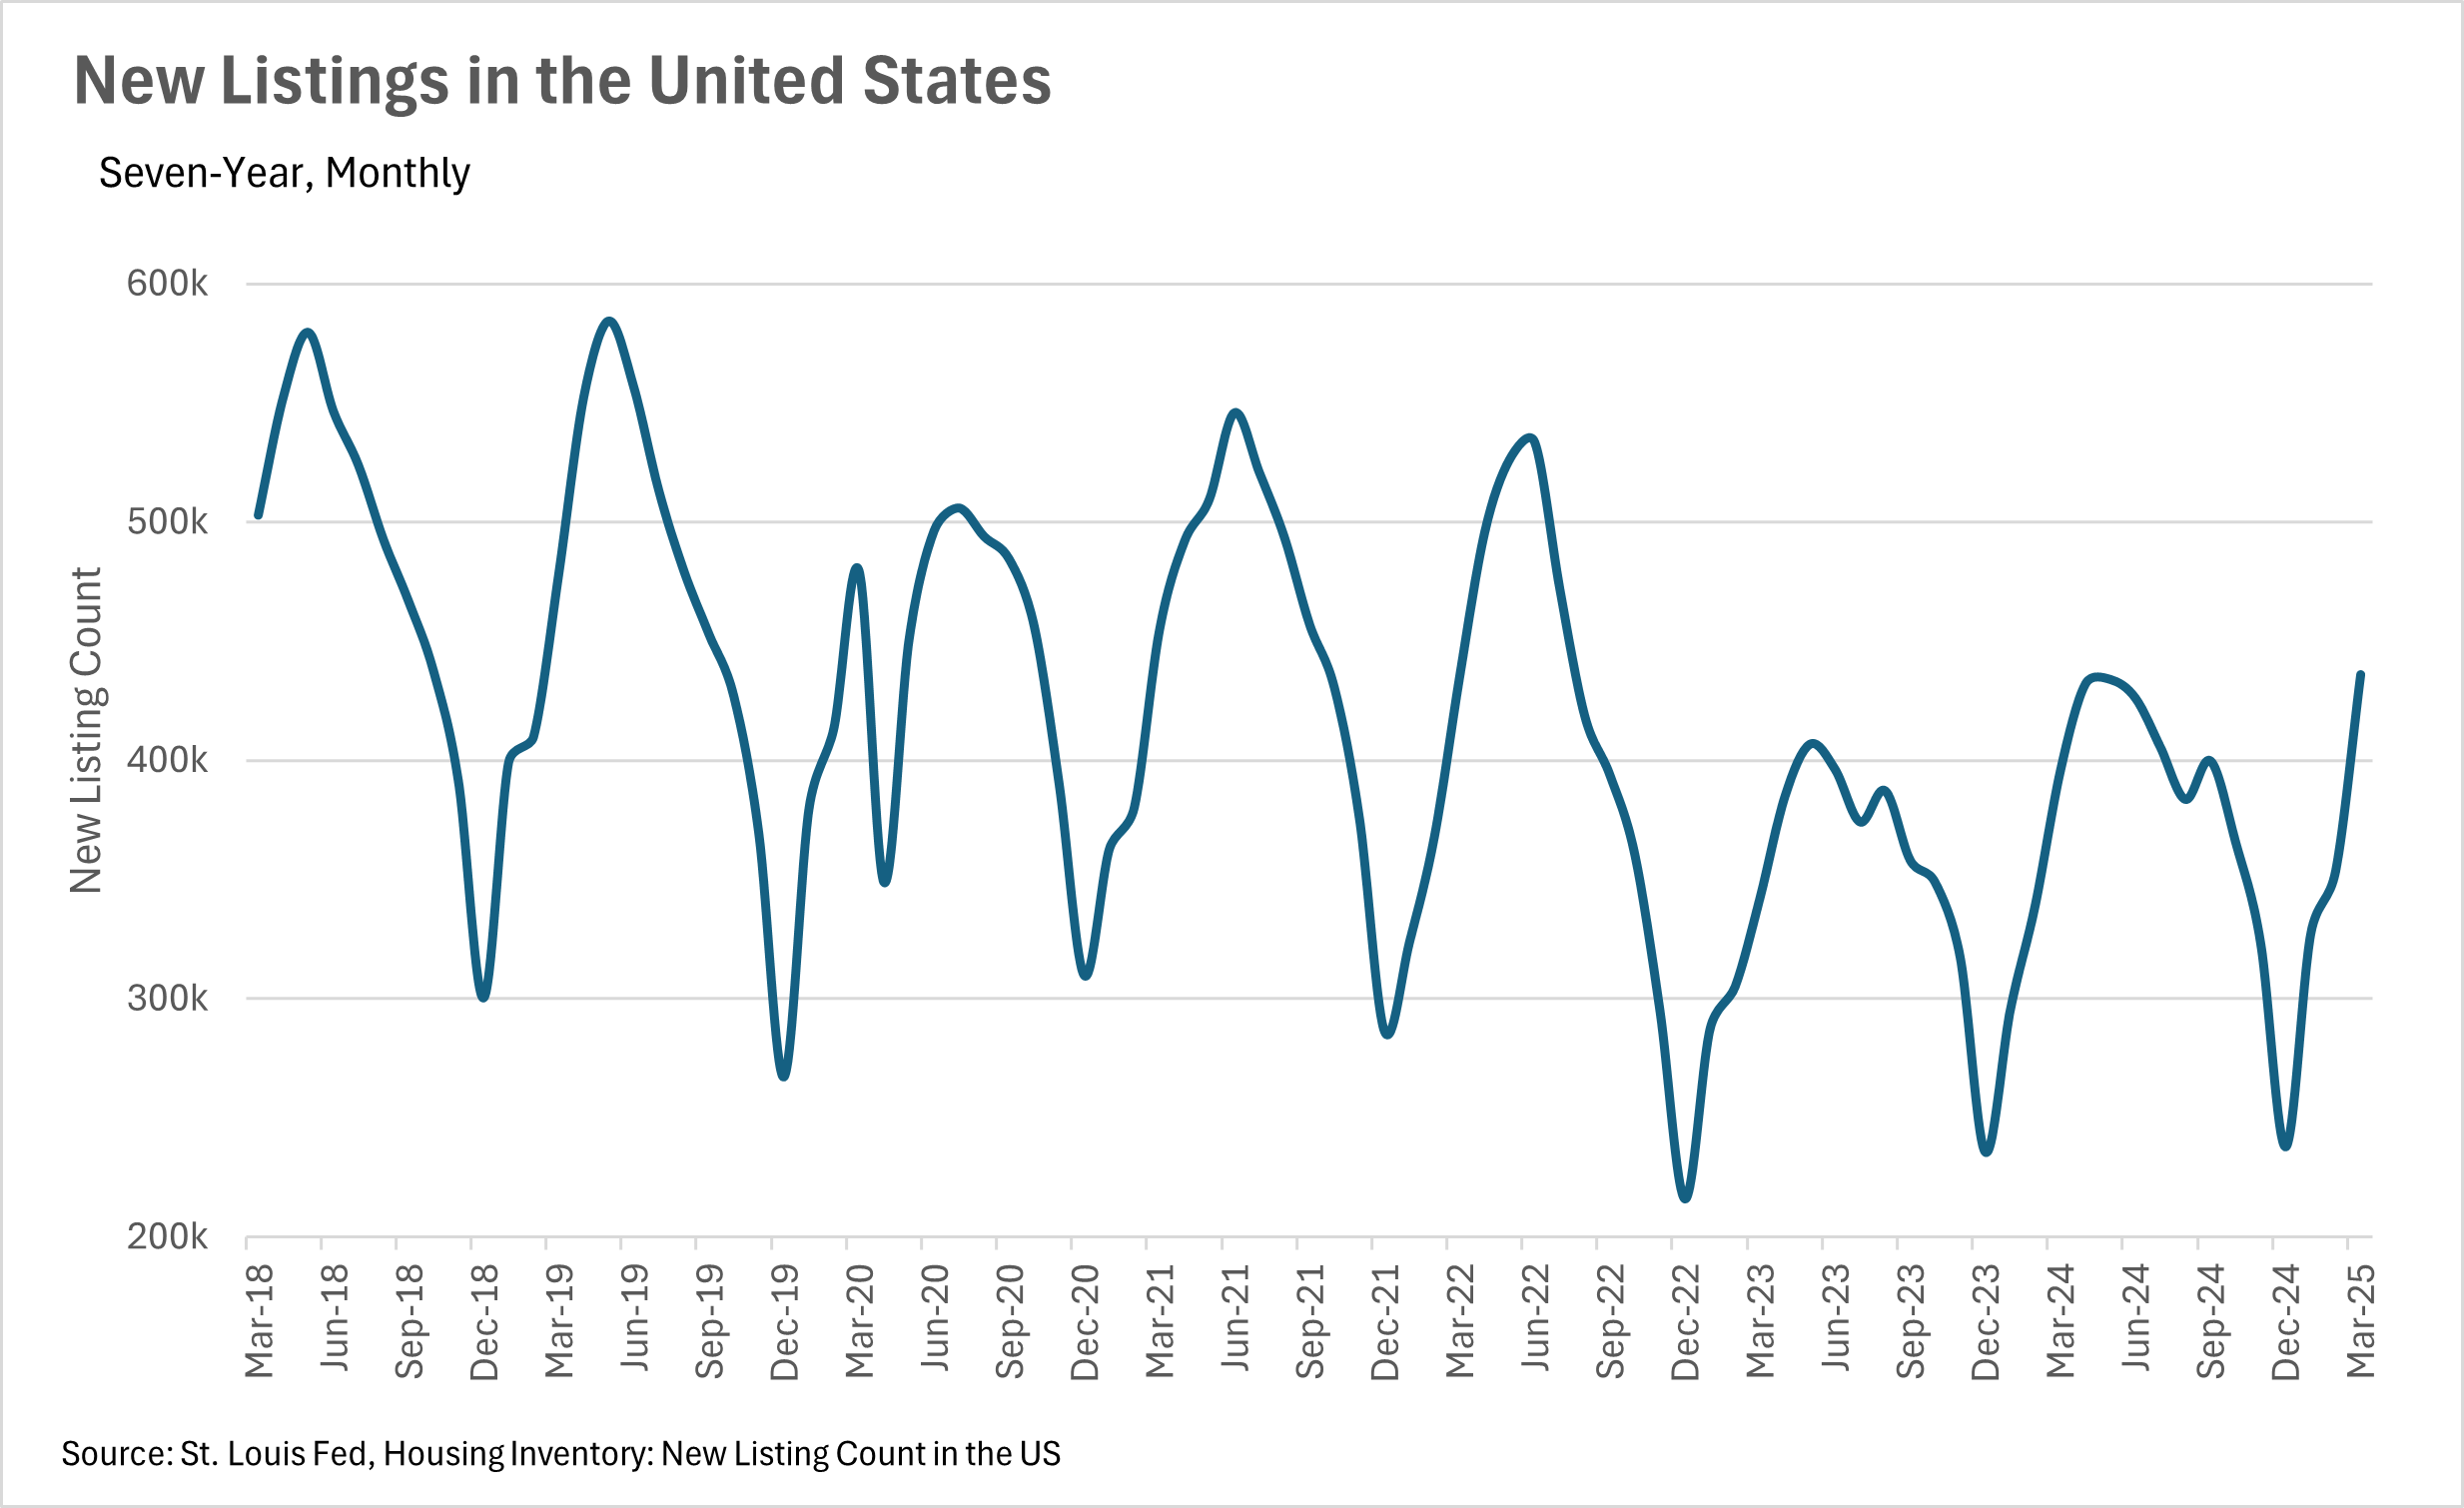
  • We are seeing the trend of more new listings hitting the market continue, as we saw roughly 10% more new listings added in March than a year ago.
 
Note: You can find the charts & graphs for the Big Story at the end of the following section.
 
*National Association of REALTORS® data is released two months behind, so we estimate the most recent month's data when possible and appropriate.
 

Home sales are roughly stagnant compared to last year

Although we are just about to exit the slow season for real estate sales, things are looking great overall. We saw a slight decrease in the number of sales on a year-over-year basis in February, with there being 4,260,000 sales in February 2025, compared to 4,380,000 in February 2024. However, on the flip side, we saw considerably more inventory added this year, with 1,240,000 homes on the market in February of this year, compared to 1,060,000 homes on the market around this time last year.
 
This means that all over the country, buyers have many more options than in recent years, which may lead to listings sitting on the market for a bit longer than what we’ve seen over the past couple of years. When you couple this with the fact that there are more new listings being added to the market, with just over 10% more listings added in March of 2025, compared to March of 2024, we might see some power start moving away from sellers to the buyers.
 
Additionally, this uptick in new listings might be an indication that sellers are starting to accept the fact that considerably lower mortgage rates aren’t coming anytime soon. Although many were holding out hope throughout the past couple of years, the Fed has made it very clear that they’re not looking to drop rates by a considerable margin anytime soon. This, of course, means that prospective sellers have an important choice to make - whether they should sell, or continue holding out. From the data that we’re seeing, it seems that many sellers are beginning to choose the former option!
 
When turning to affordability, we saw a rather interesting phenomenon - median monthly P&I payments decreased by nearly 5%, all while interest rates and median sale prices increased by just under 4%. This likely means that there was a considerable cohort of homeowners out there that locked in rates toward the end of 2023 when rates were at a local high, and recently refinanced when rates came down a bit. The median consumer having an additional $100 in their pocket every month is a great thing for the economy, especially when we face economic uncertainty, tariffs, and ever-changing geopolitics!
 
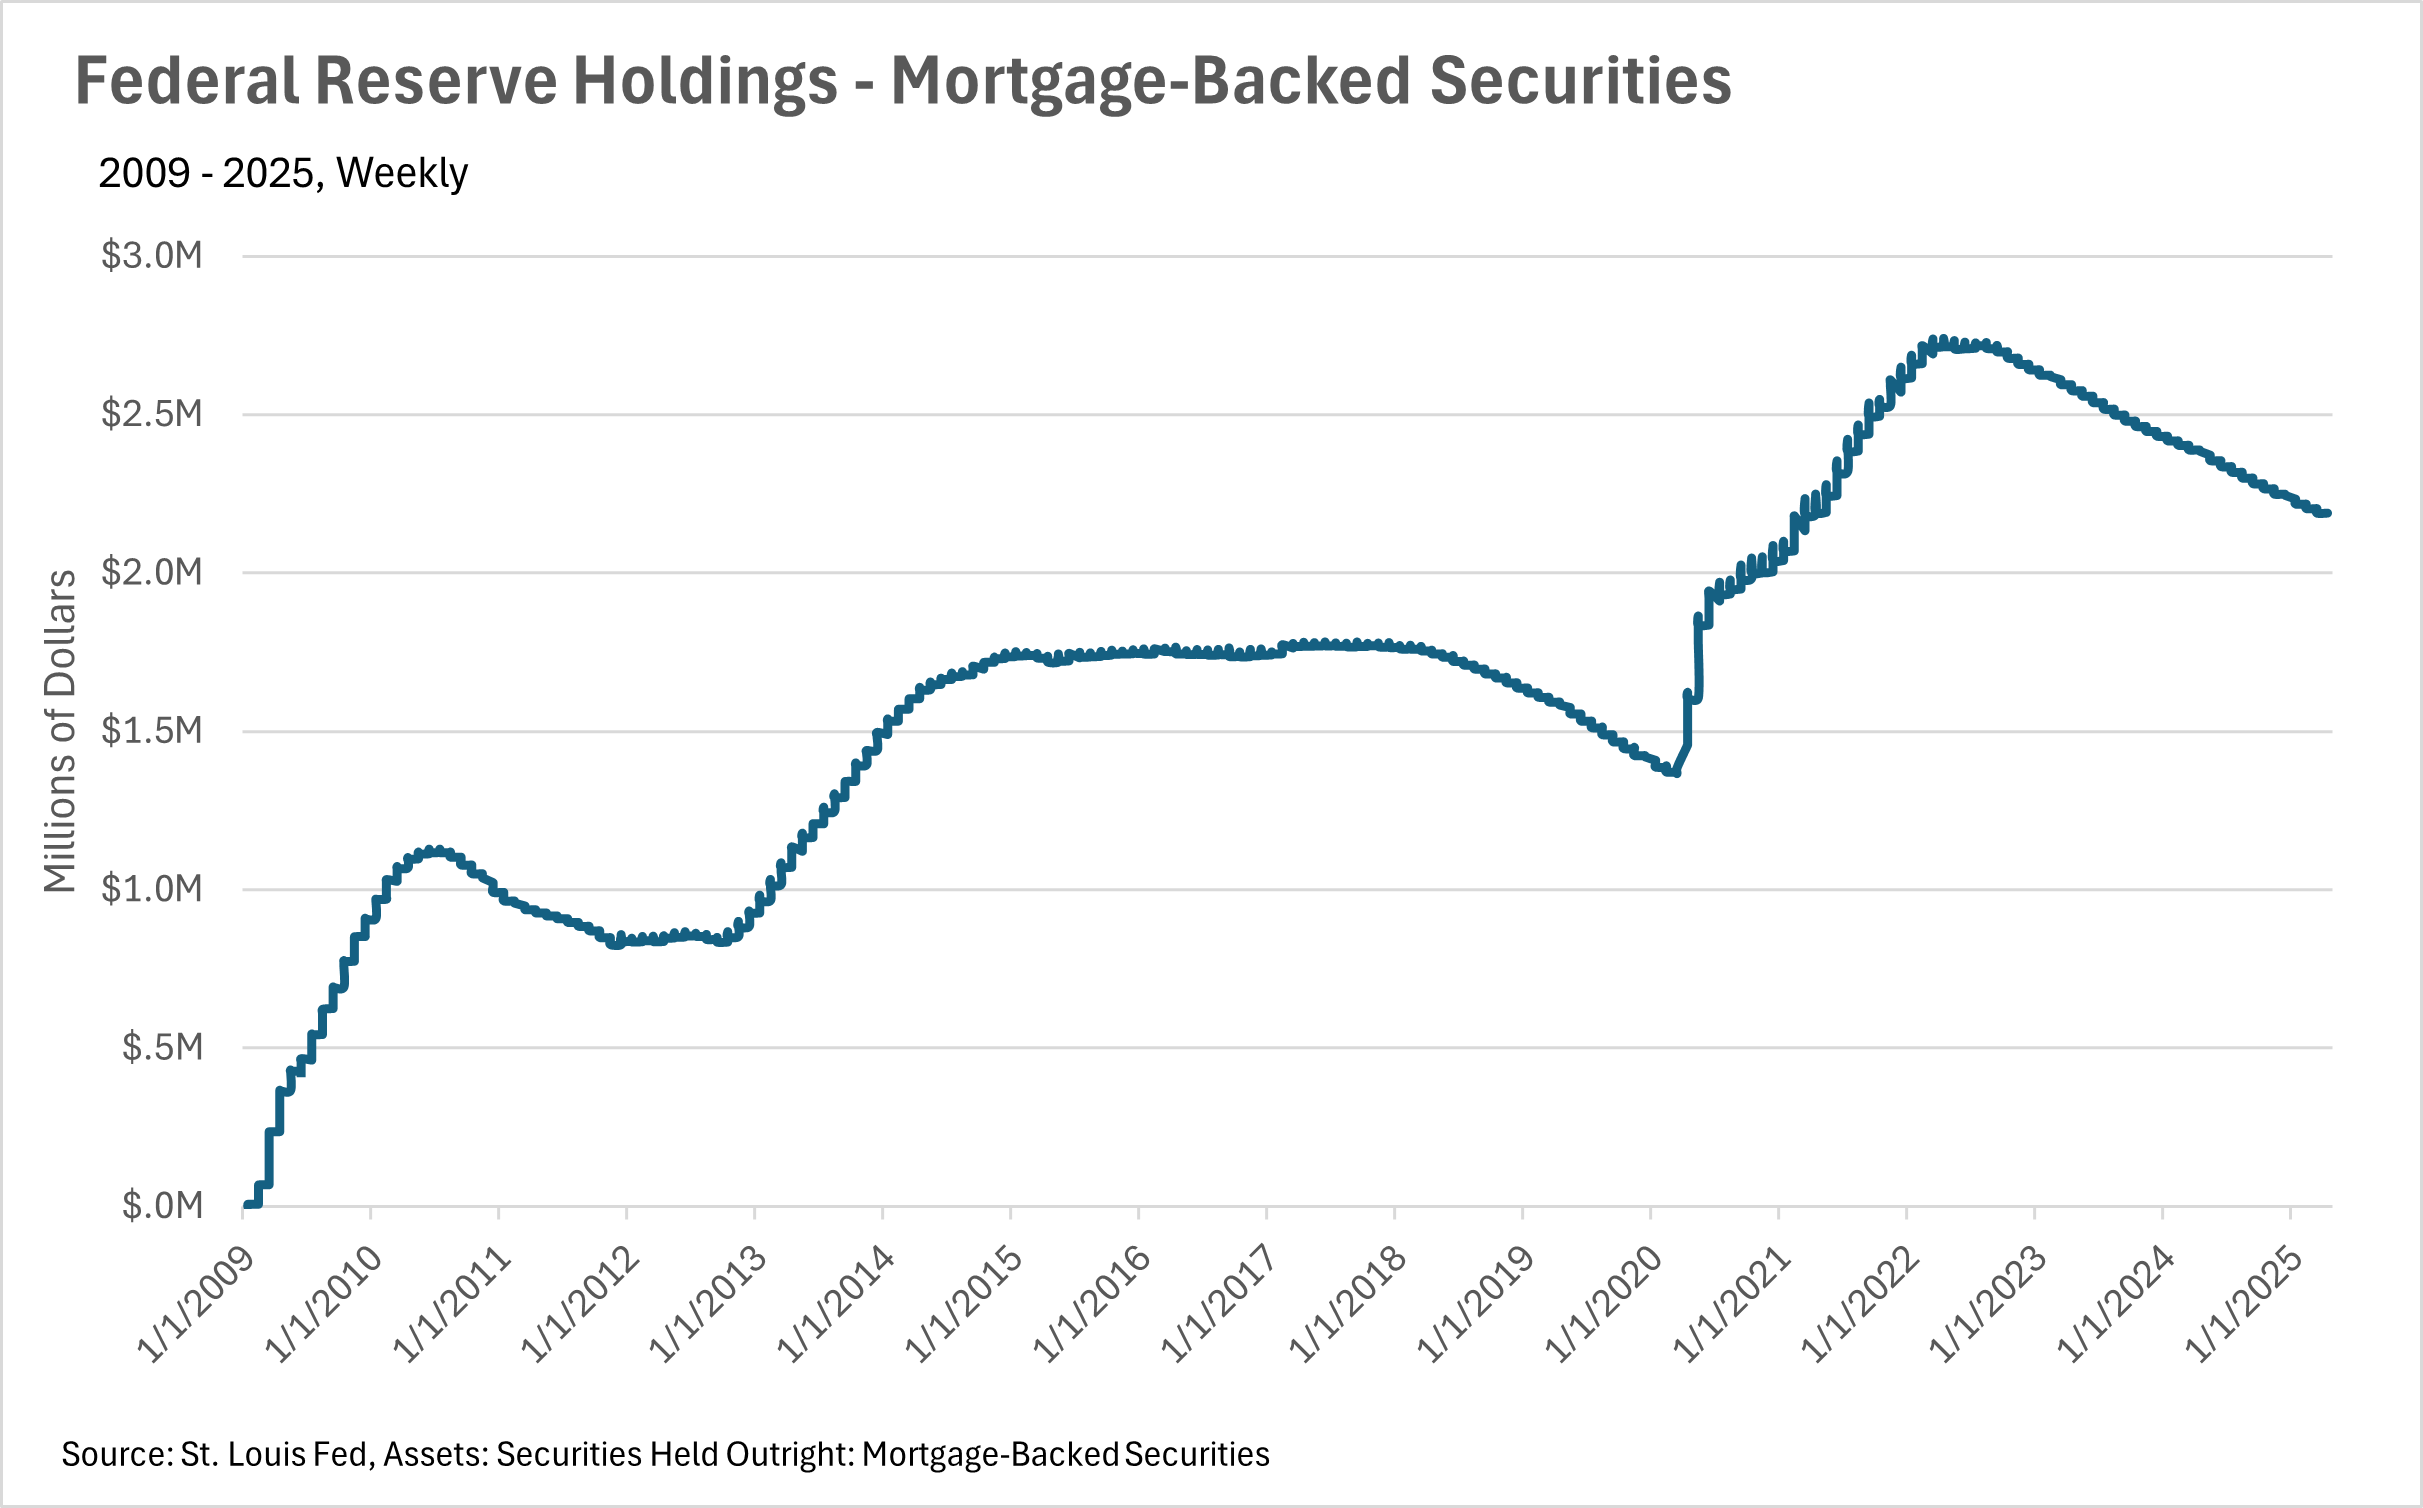
Lastly, it’s important to note that it’s business as usual in terms of the Federal Reserve. In their recent FOMC meeting, they decided to hold the federal funds rate firmly where it has been over the past couple of months. Fed officials also indicated that they are not in a rush to lower rates by a considerable margin anytime soon. However, that could always change, as we’re living in an incredibly dynamic era right now! Additionally, the Fed is continuing to offload mortgage-backed securities at a steady pace!
 
Ultimately, though, this is just what we’re seeing at a national level. As we all know, real estate is an incredibly localized industry, so knowing what’s going on in your market is pivotal. Below is our local lowdown, which outlines everything you need to know about what’s happening around you in your neighborhood and surrounding areas!

Big Story Data
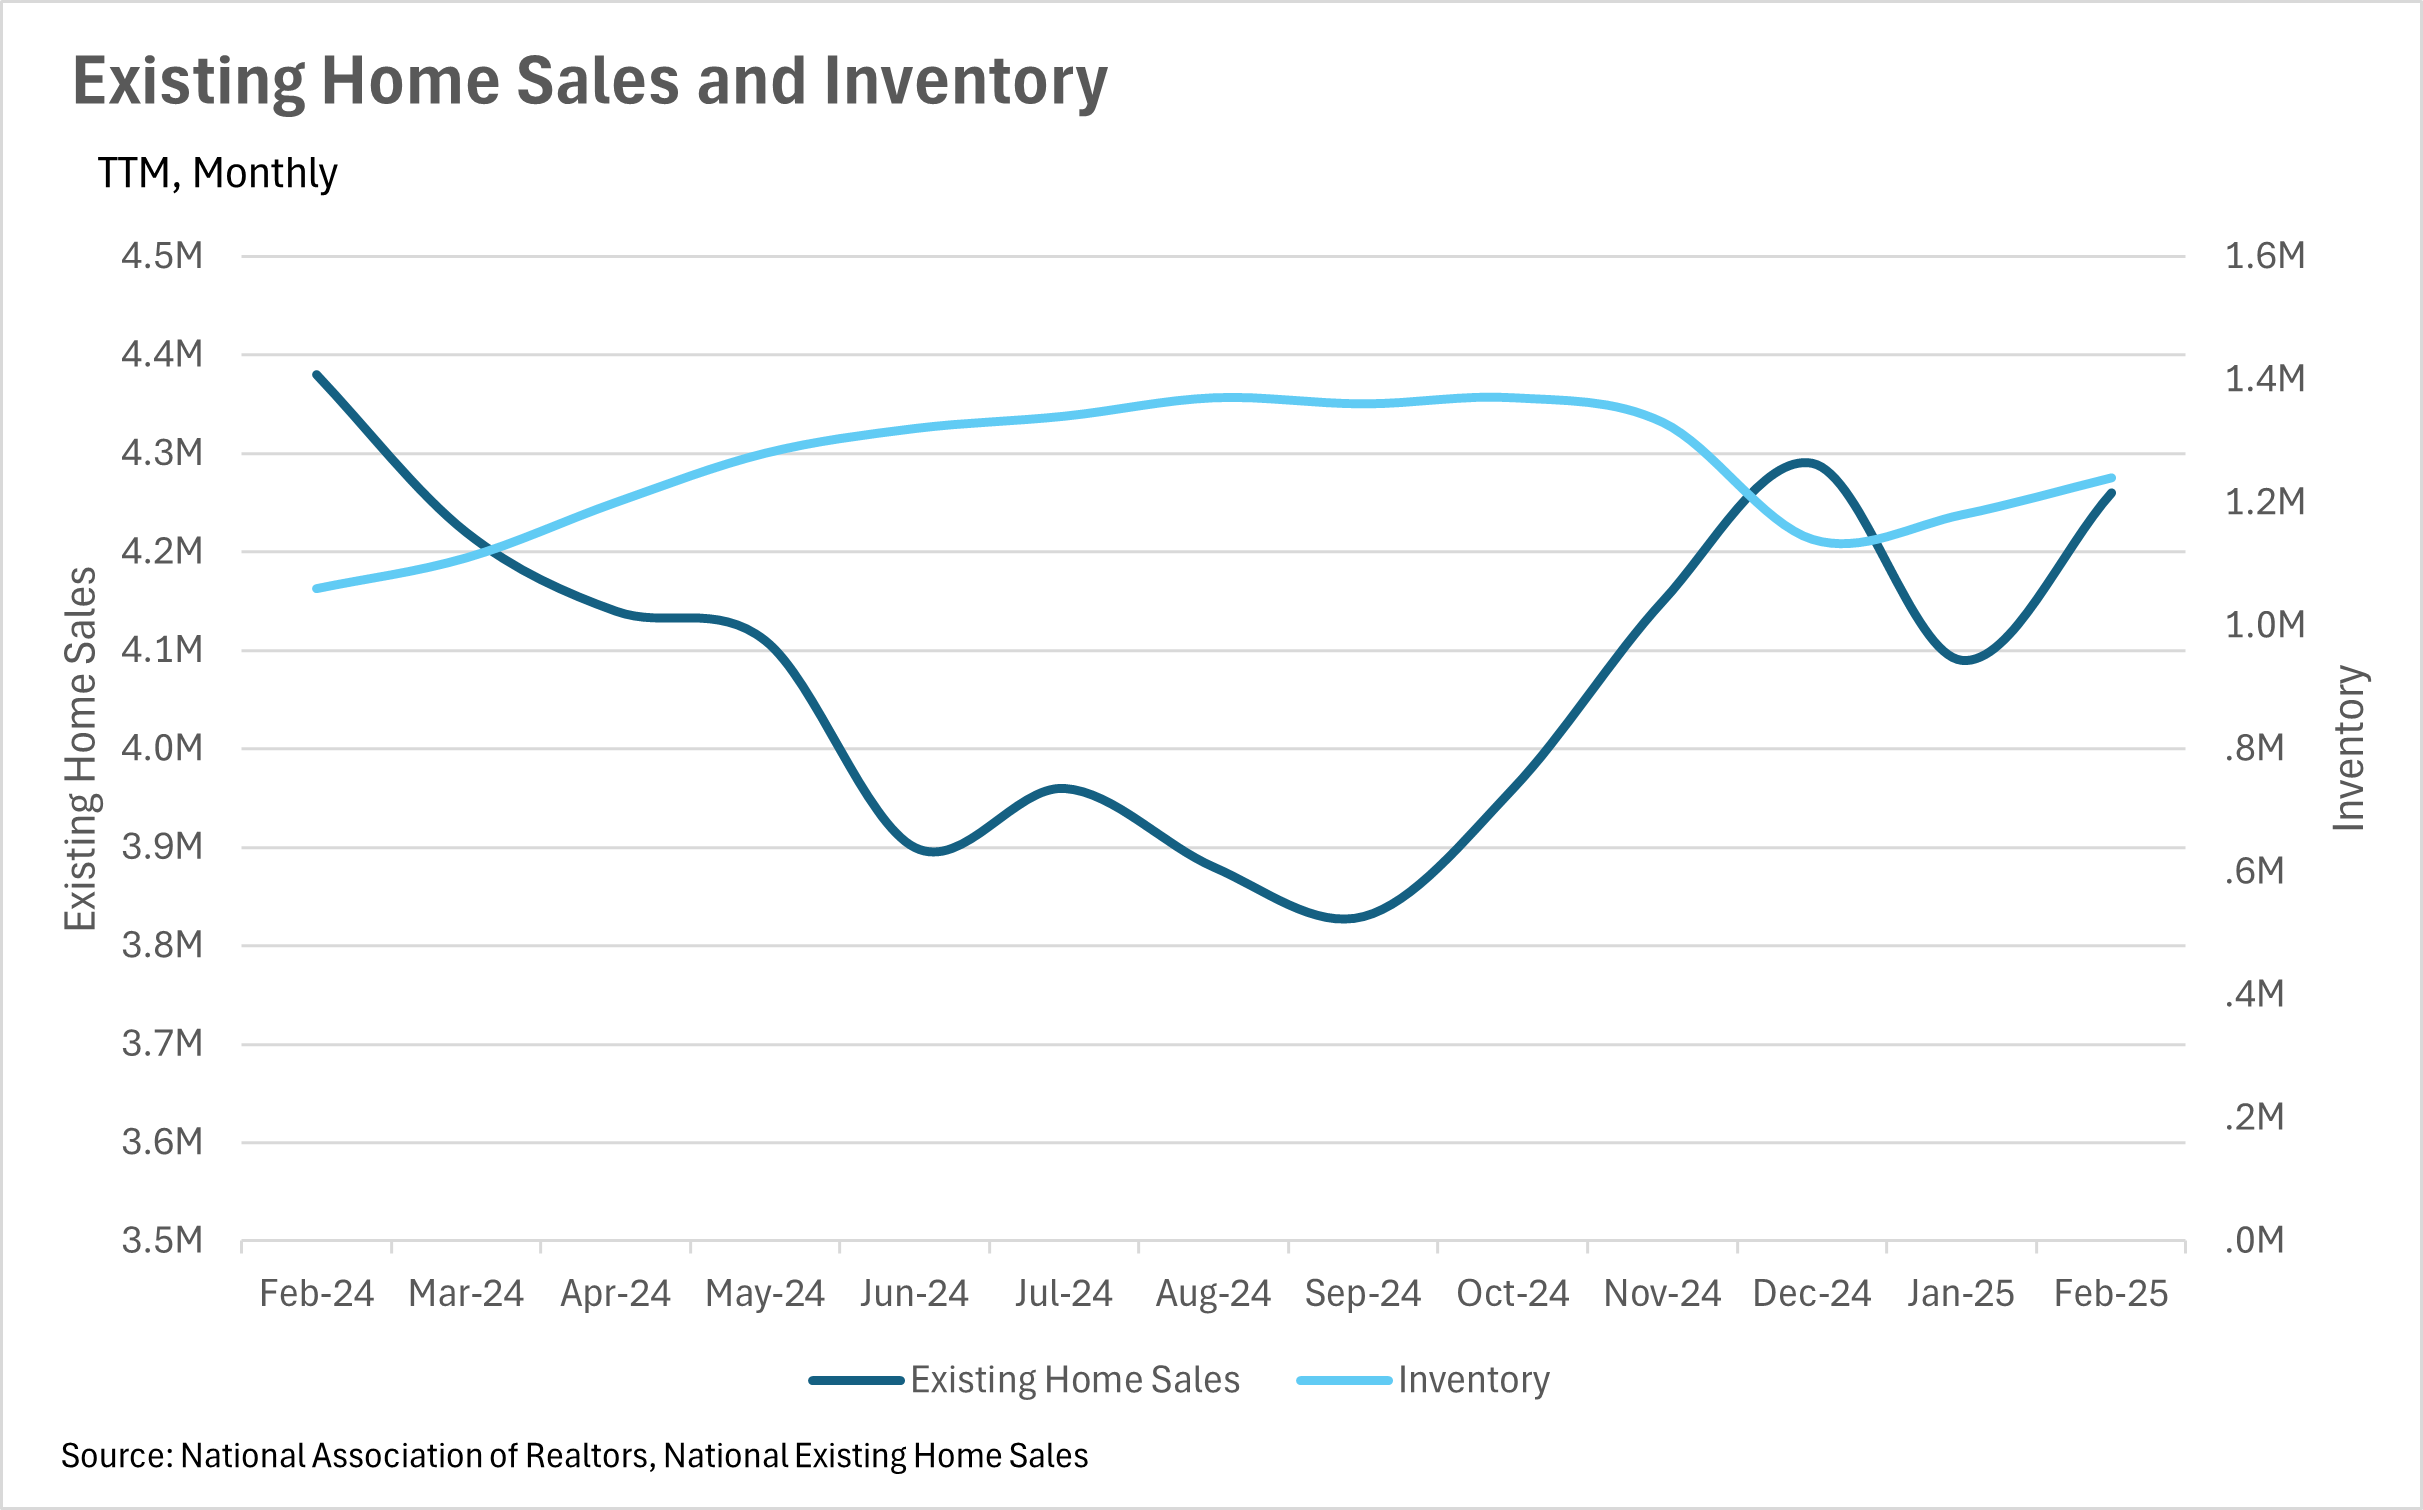
Line chart comparing existing home sales and inventory from February 2024 to February 2025.

Chart of Federal Reserve mortgage-backed securities holdings, peaking around $2.7 million in 2022 before declining through 2025.Bar chart of median monthly principal and interest payments from January 2024 to January 2025, ending at $2,148.Chart of monthly U.S. home sale prices and 30-year mortgage rates, February 2024 to February 2025.Line chart of monthly U.S. new listings from March 2018 to March 2025, with recurring seasonal peaks and dips.

The Local Lowdown

Quick Take:

  • Housing markets across the Bay Area show mixed signals, with single-family homes outperforming condos in most regions.
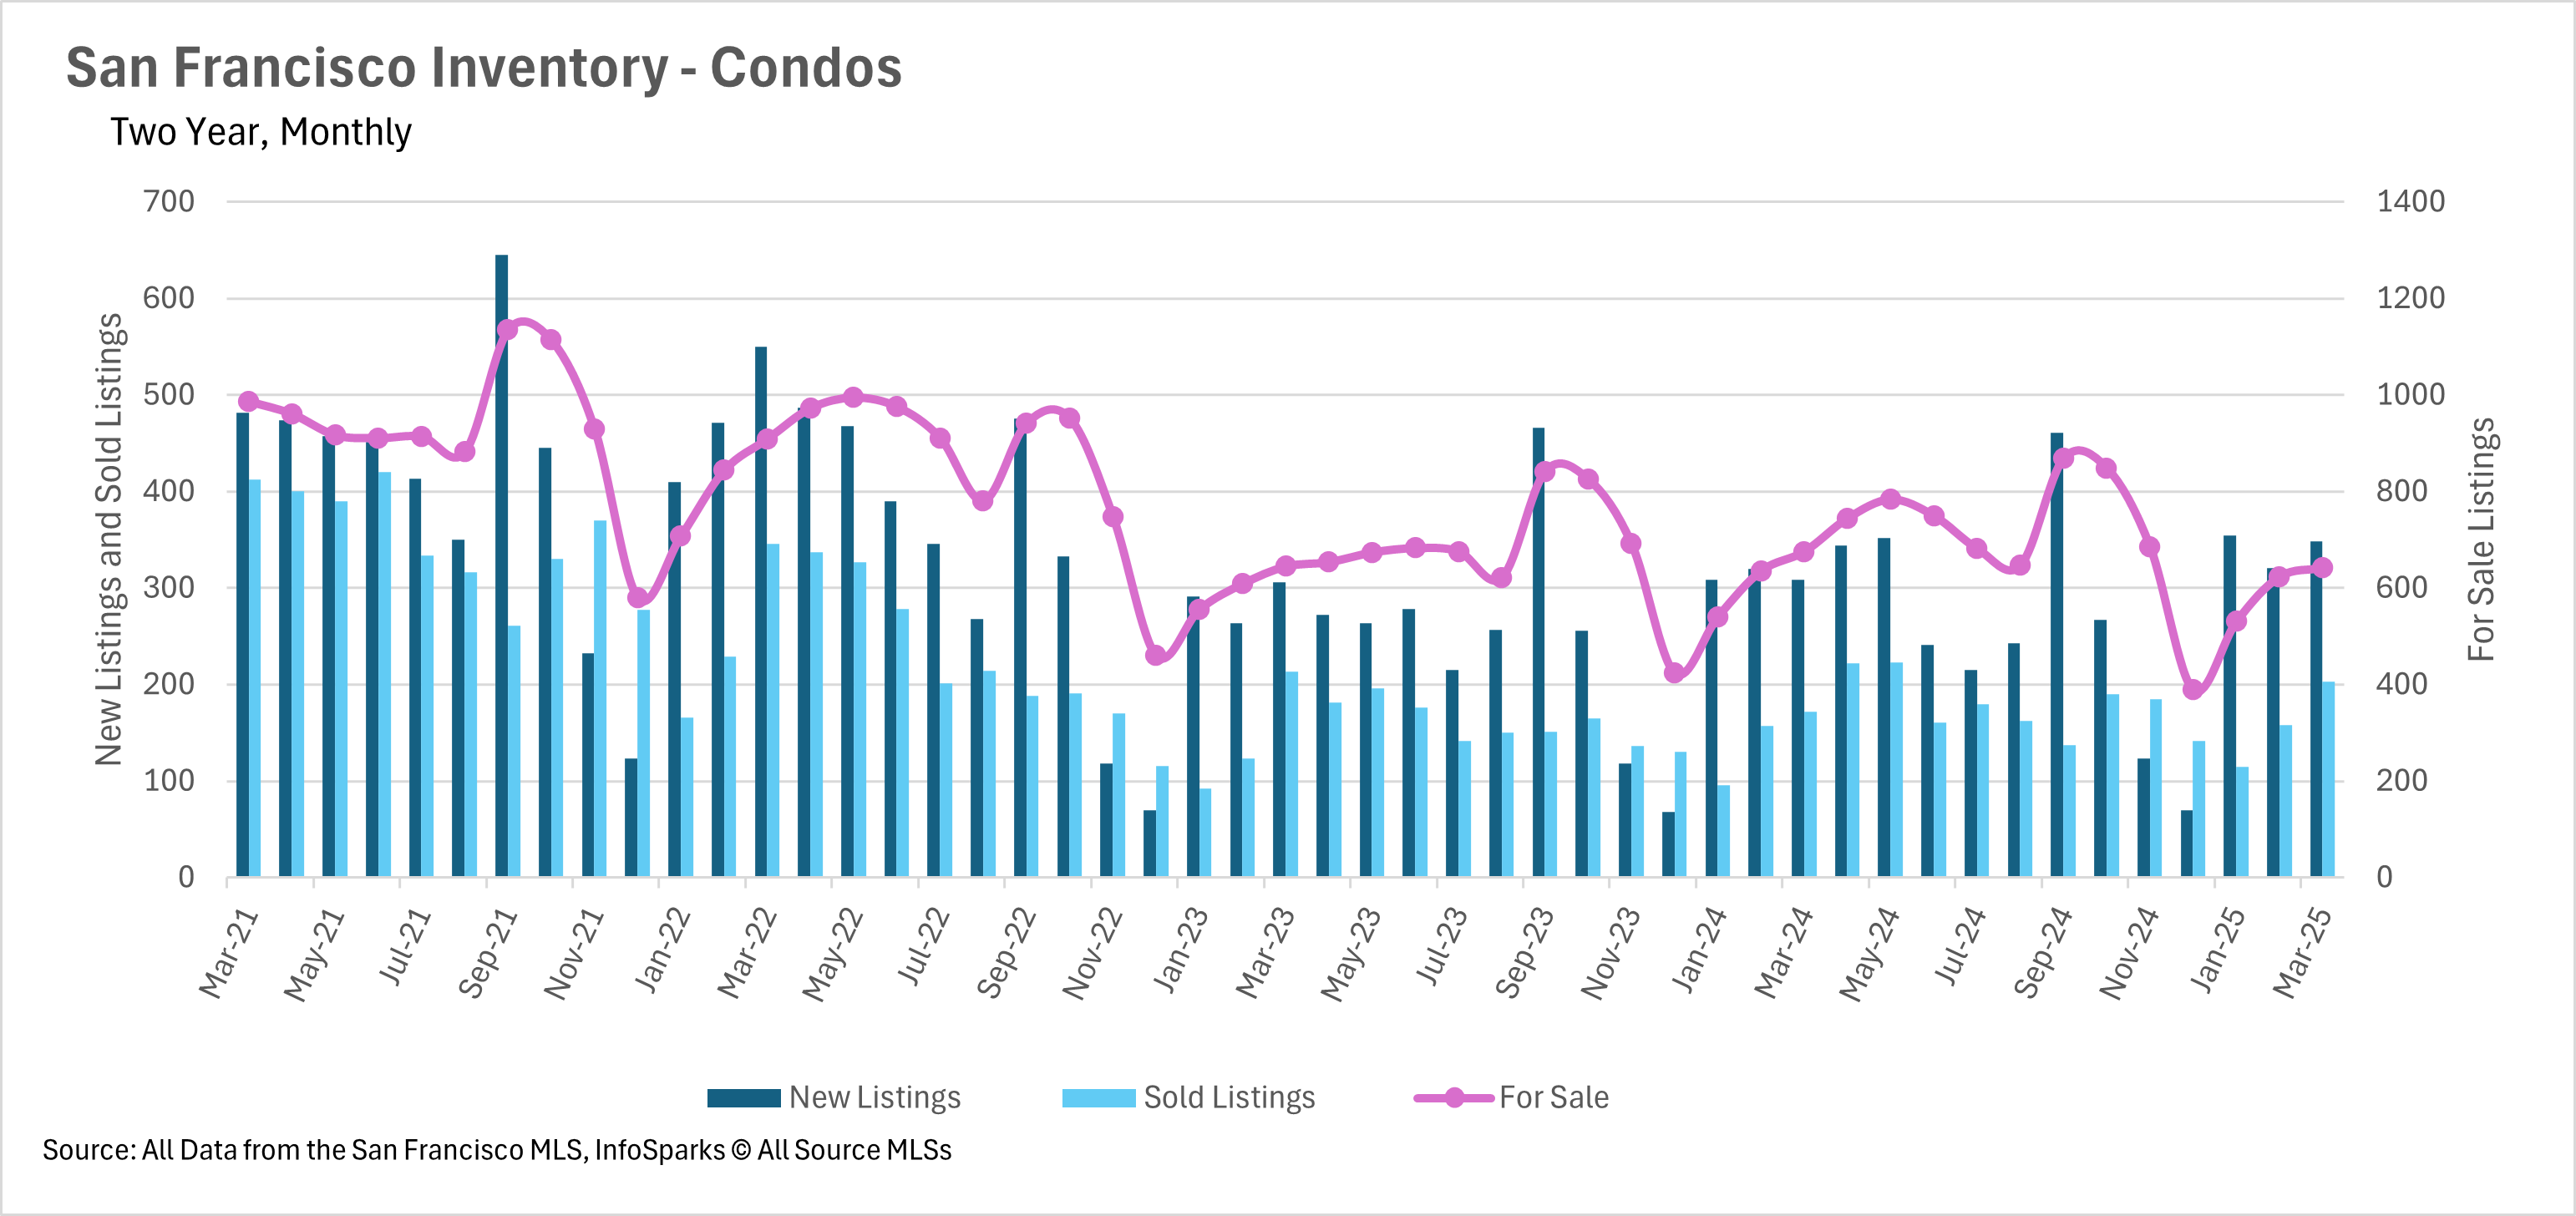
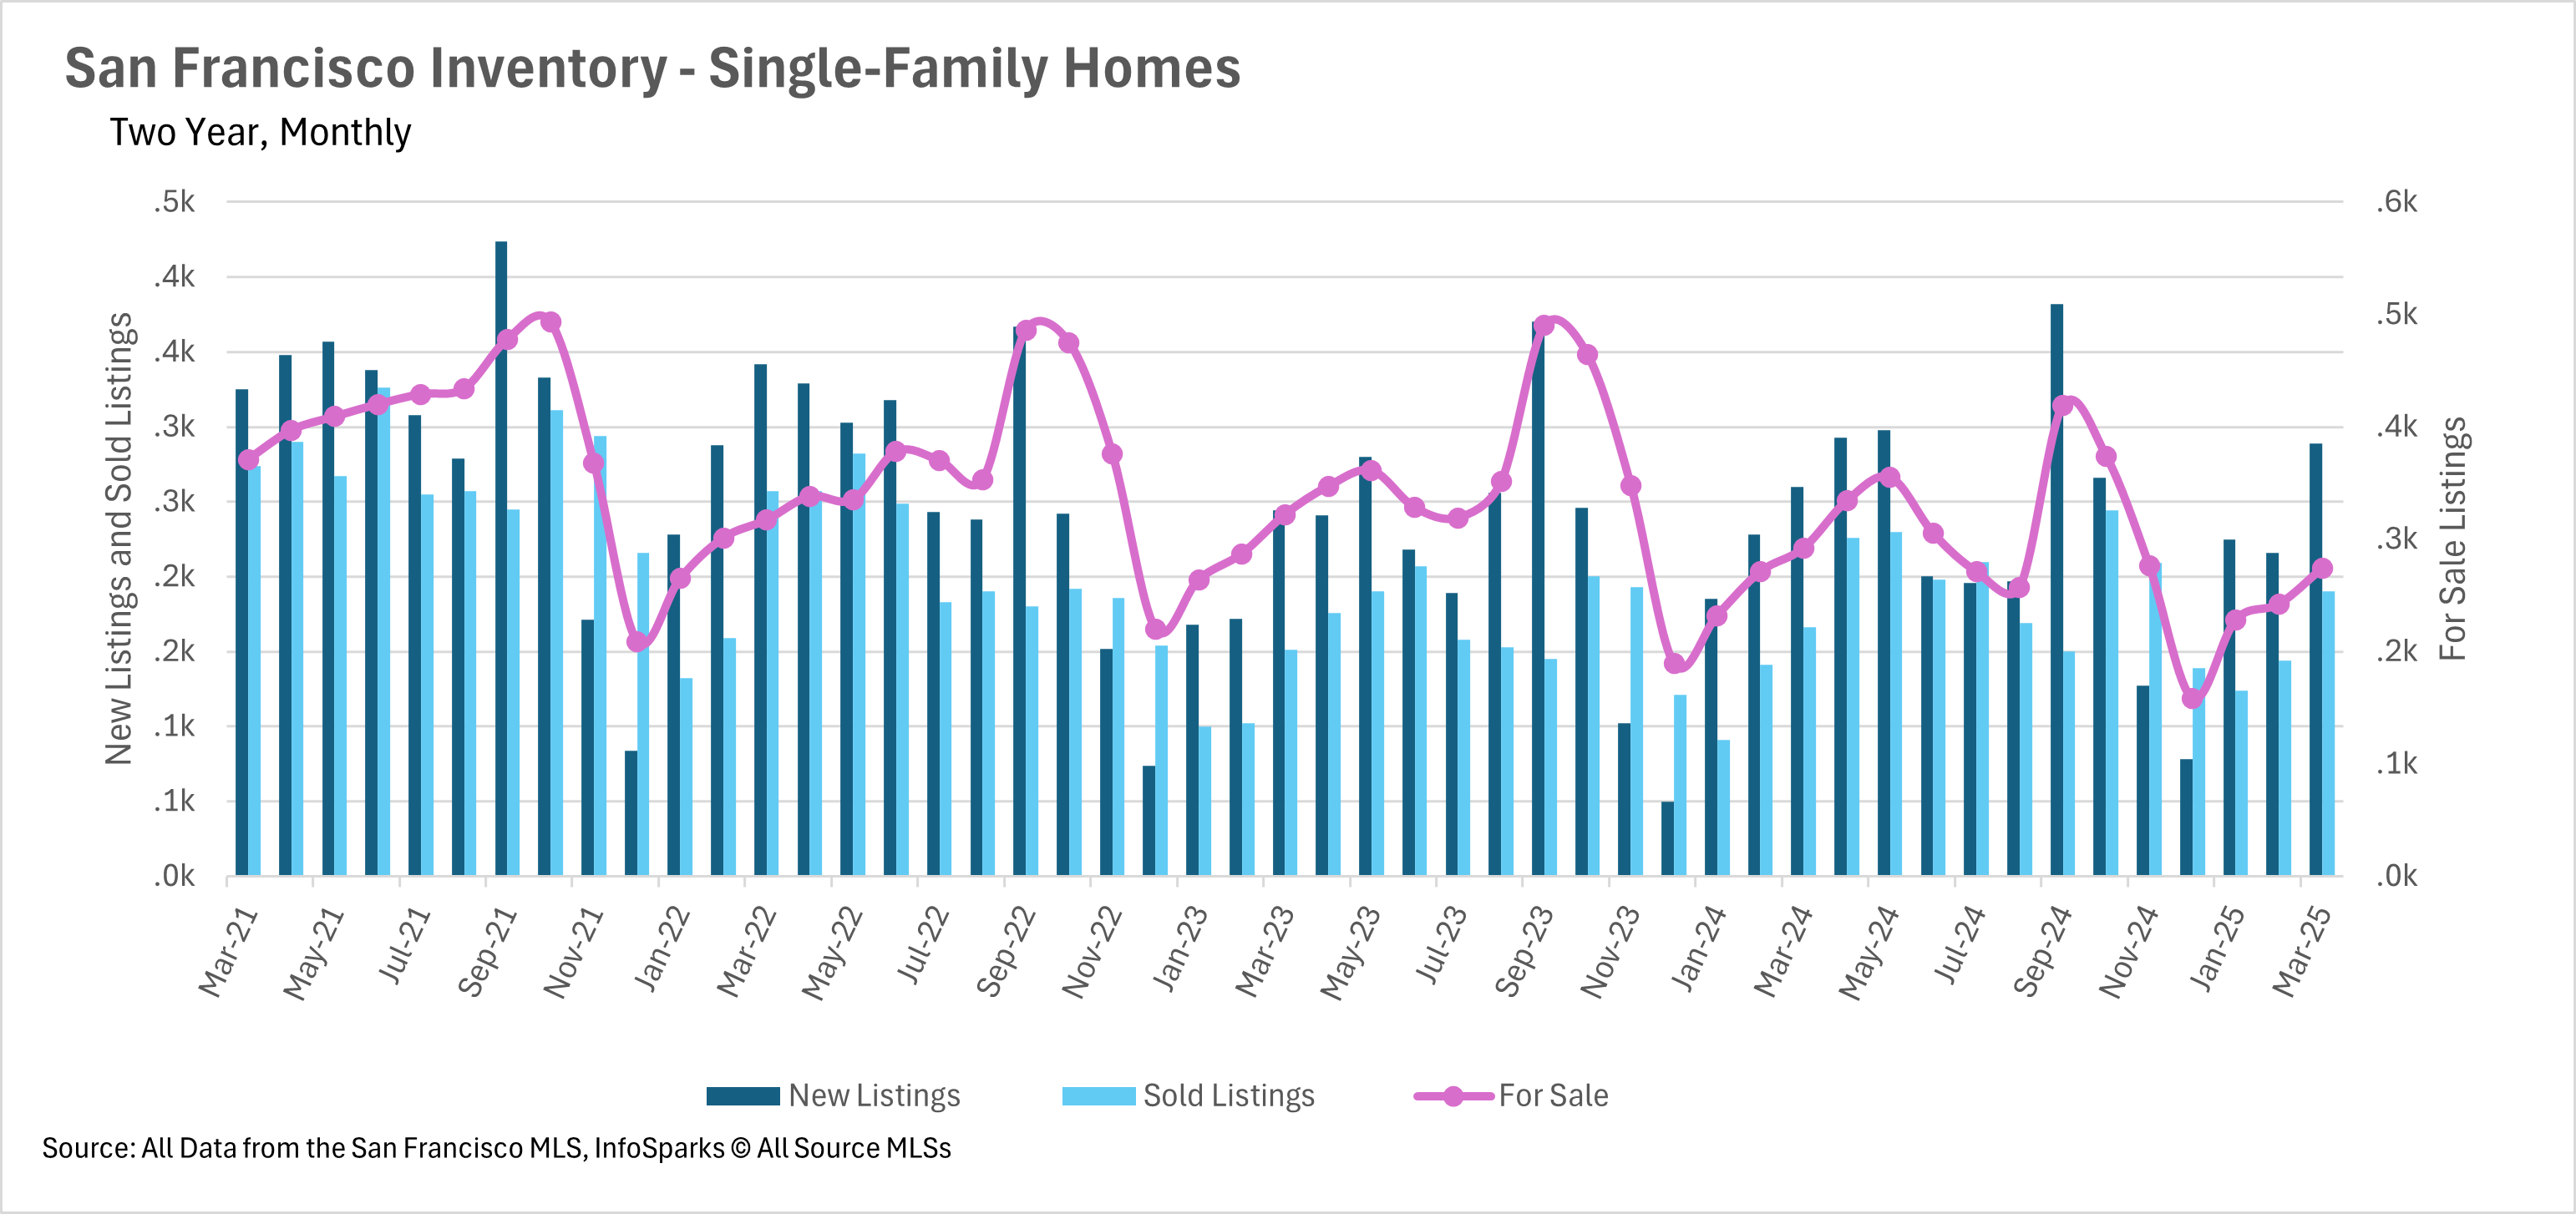
  • Inventory trends vary significantly by region, with Silicon Valley seeing increases while San Francisco continues to struggle with low supply.
  • Single-family homes in most Bay Area regions remain in a seller's market, while the condo market generally favors buyers with higher months of supply inventory.
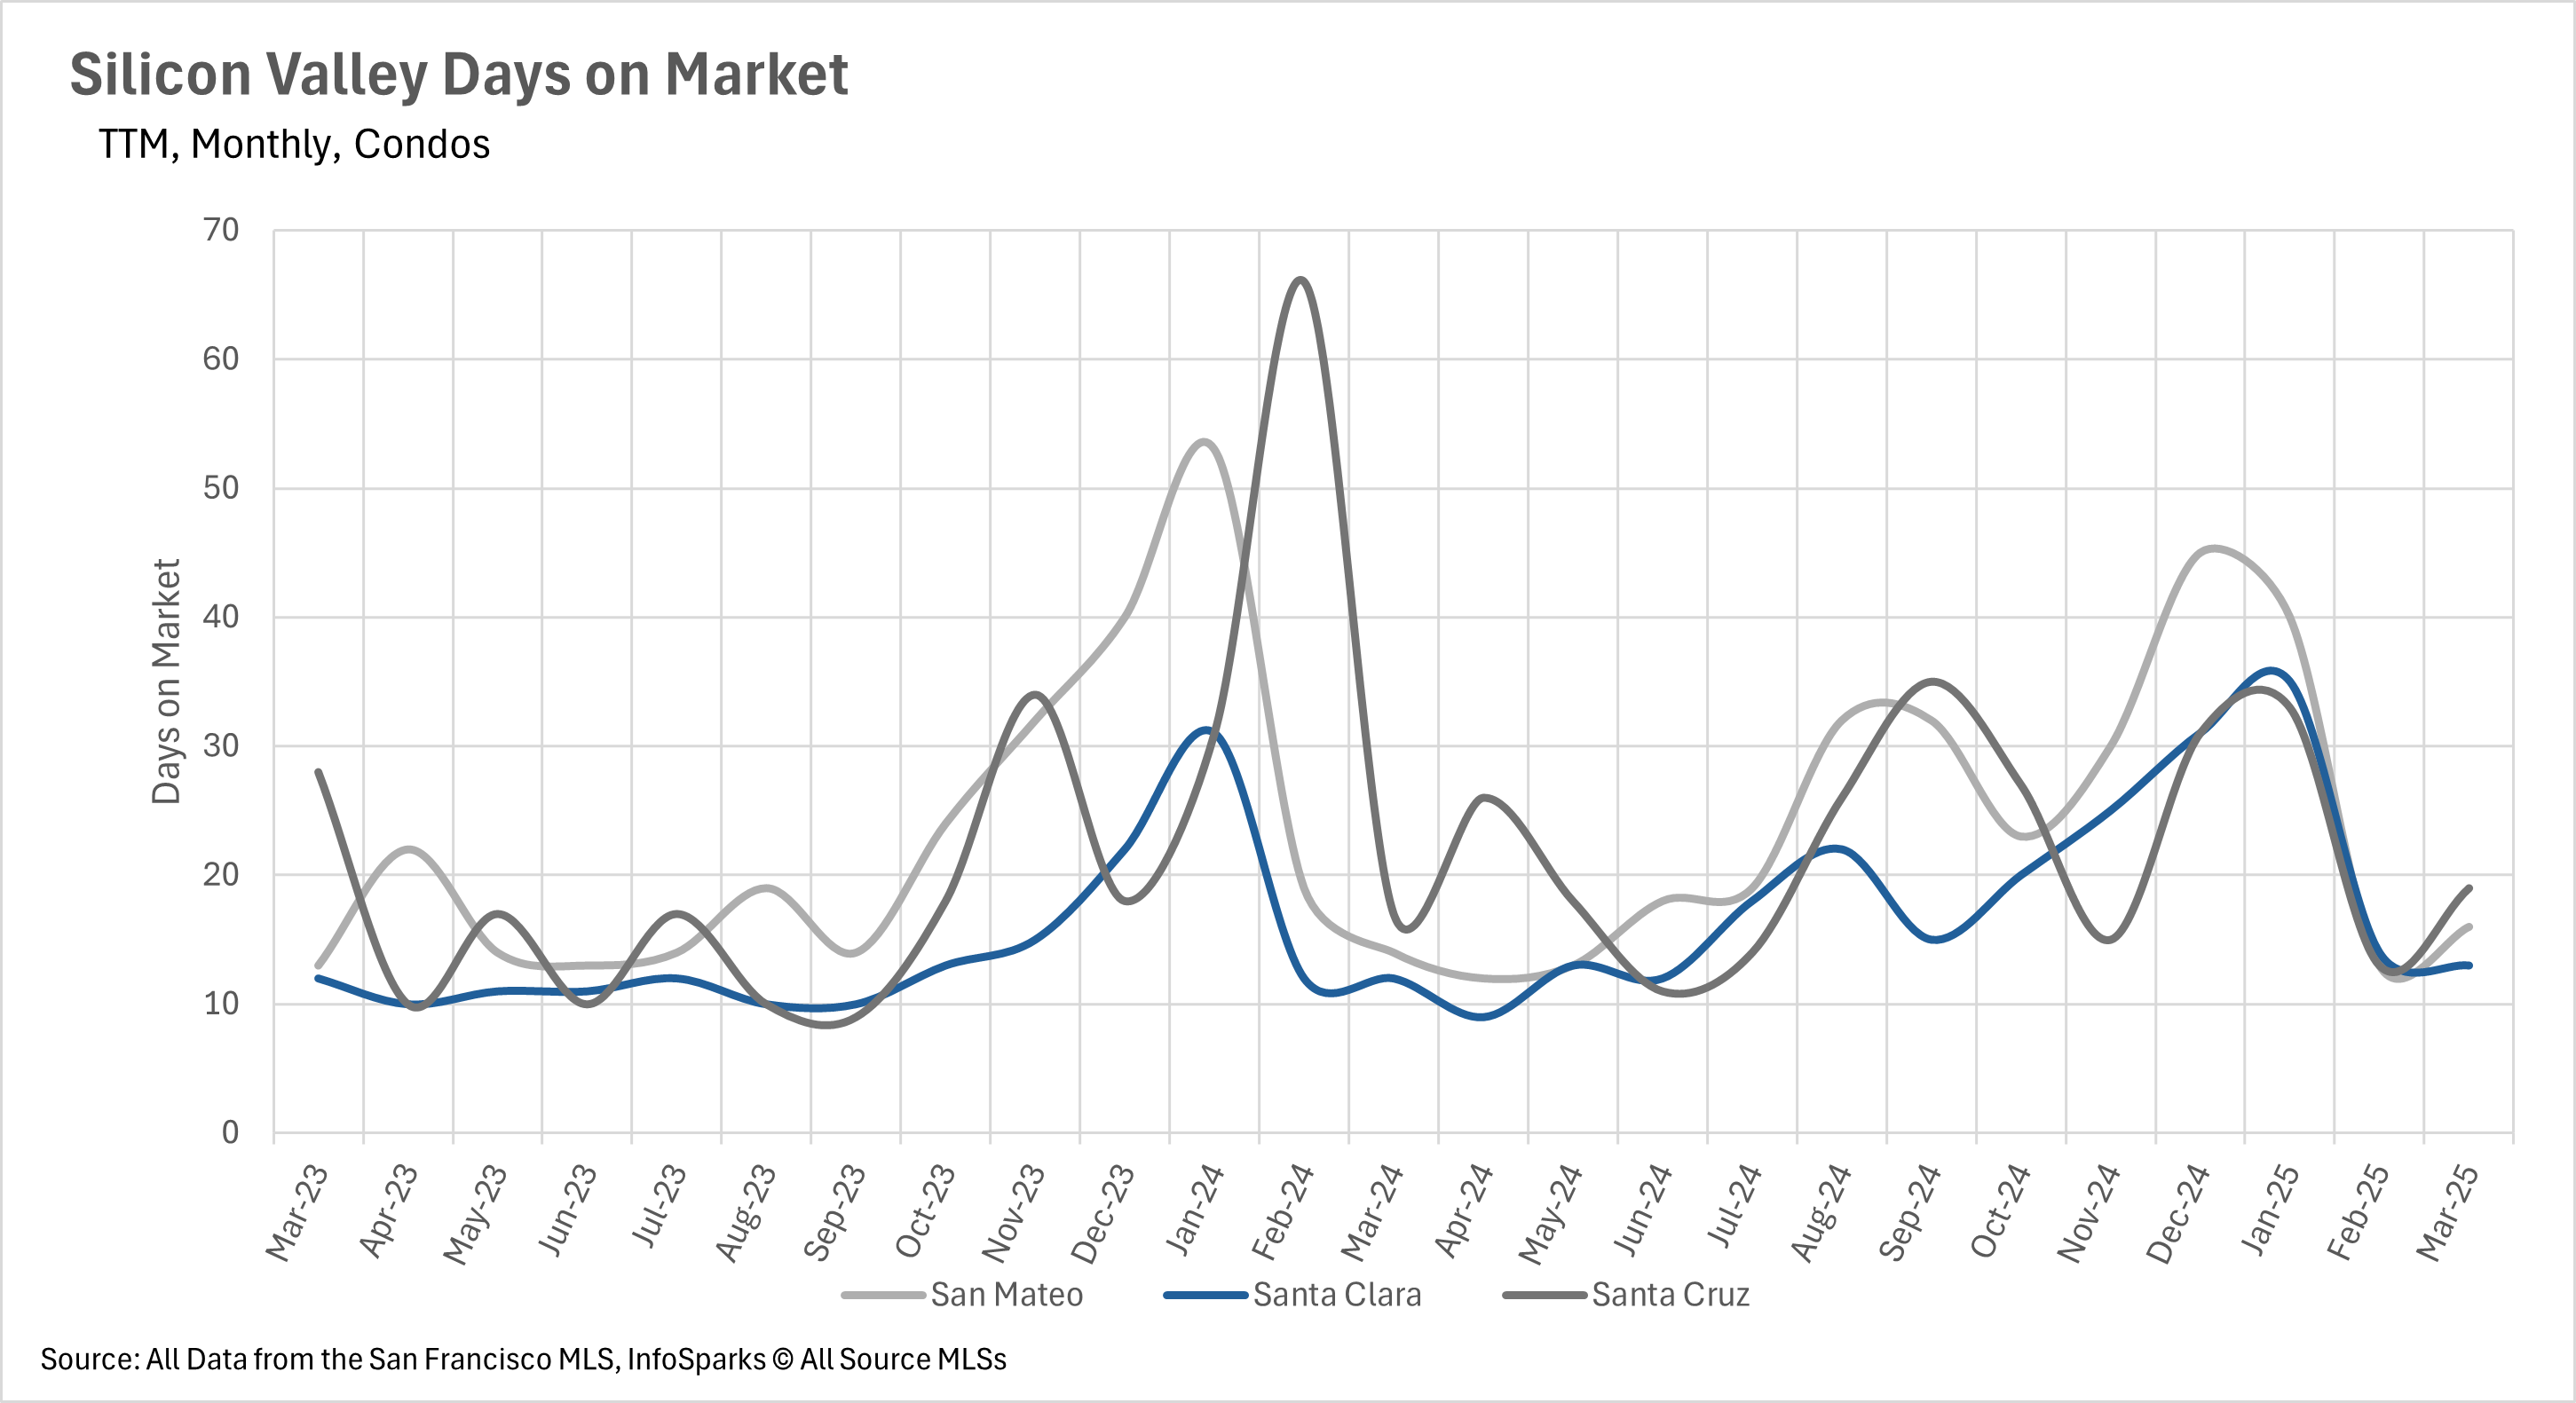
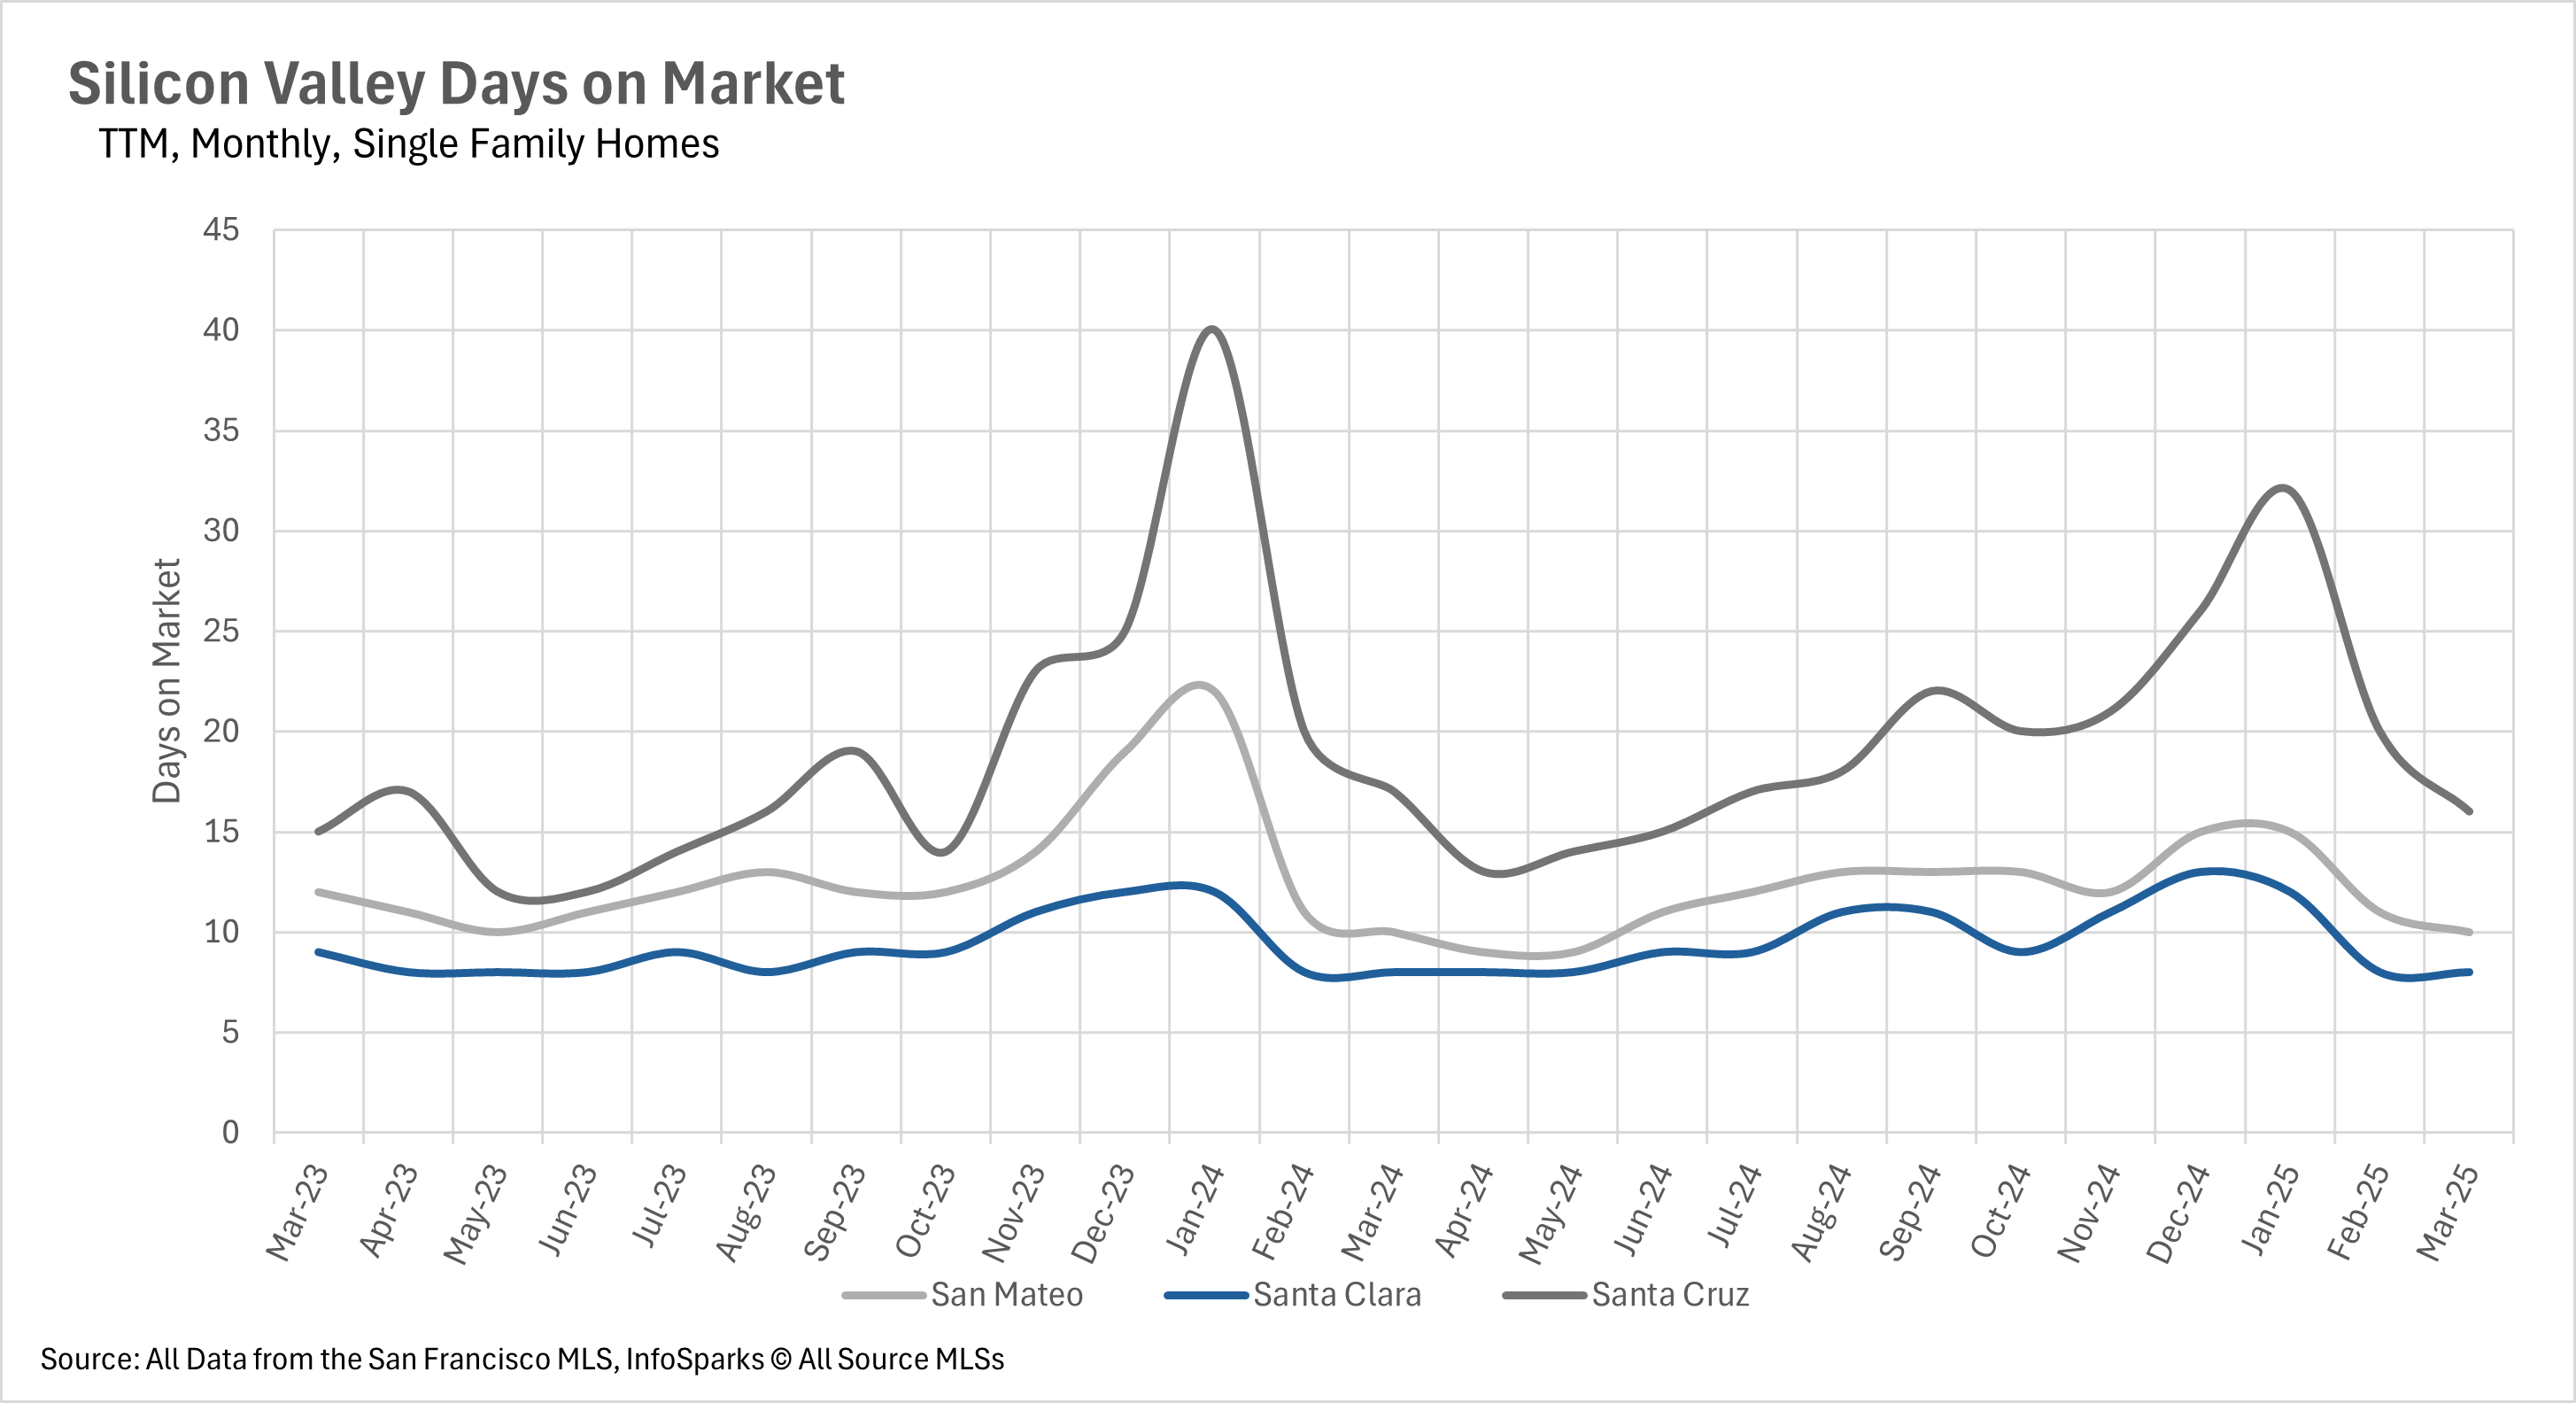
  • Days on market vary dramatically across the Bay Area, from just 8-16 days in Silicon Valley to significantly longer timeframes in other regions.
 
Note: You can find the charts/graphs for the Local Lowdown at the end of this section.
 

Bay Area home values show divergent trends across regions

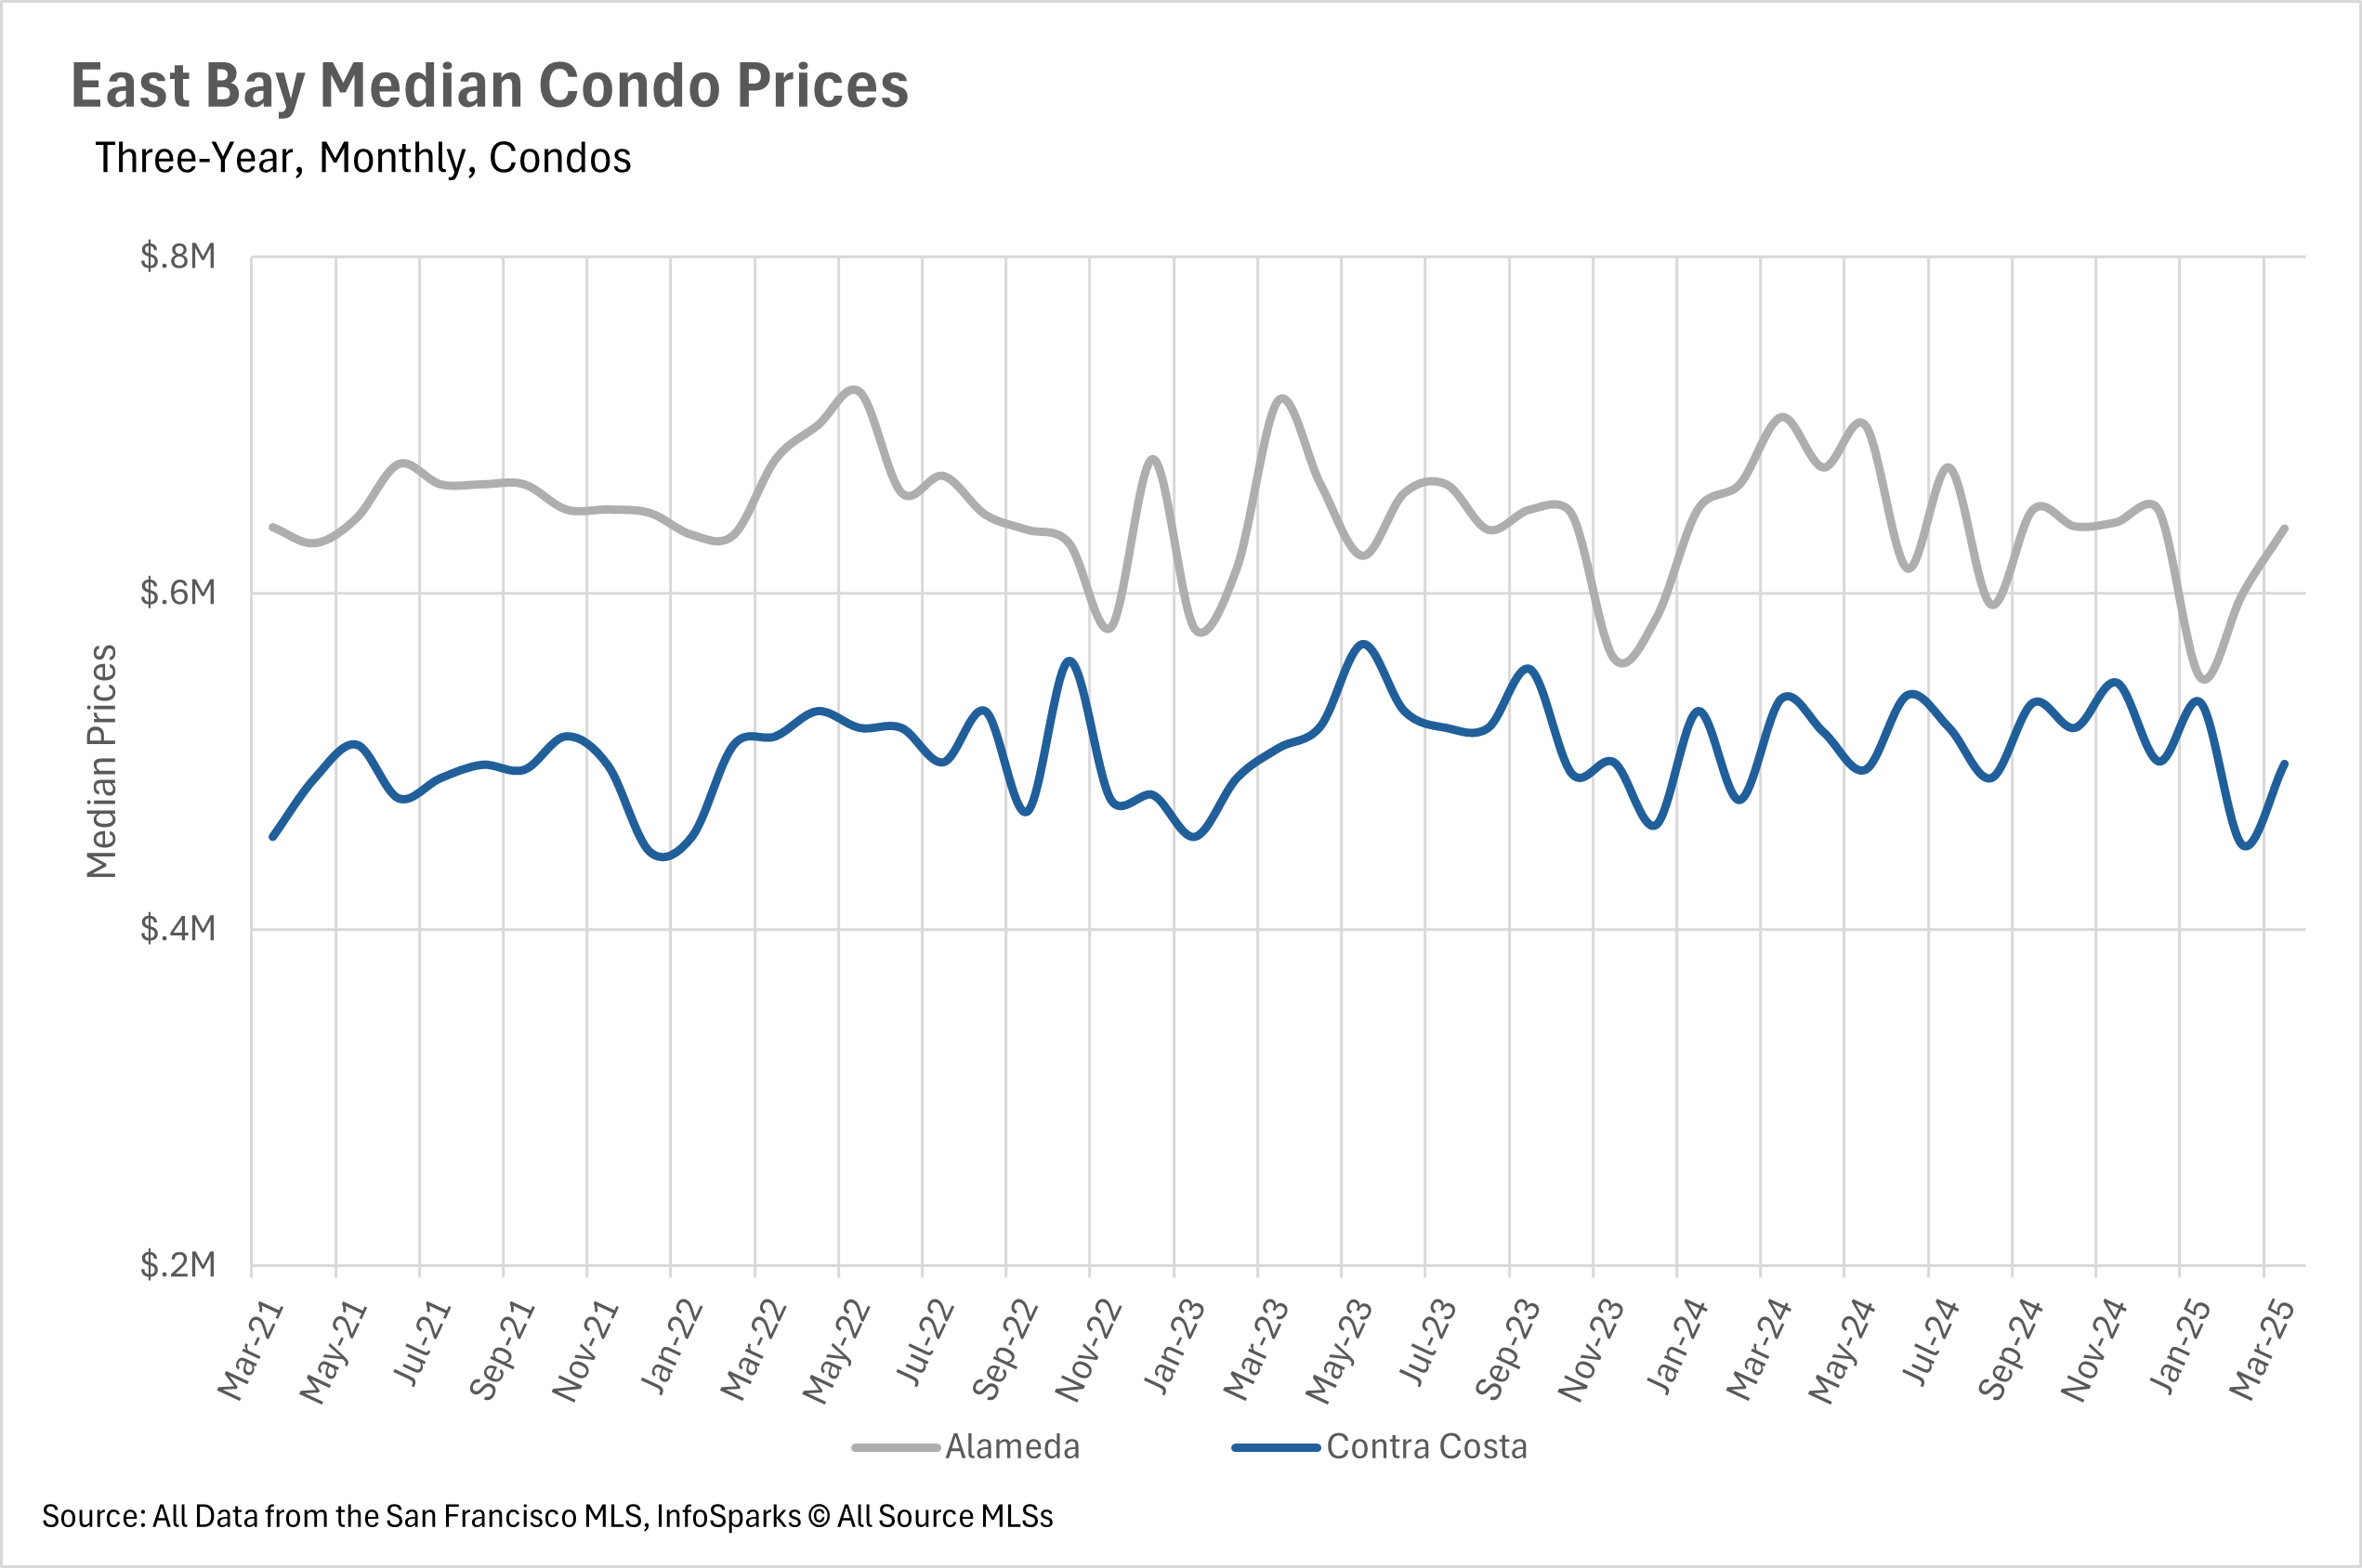
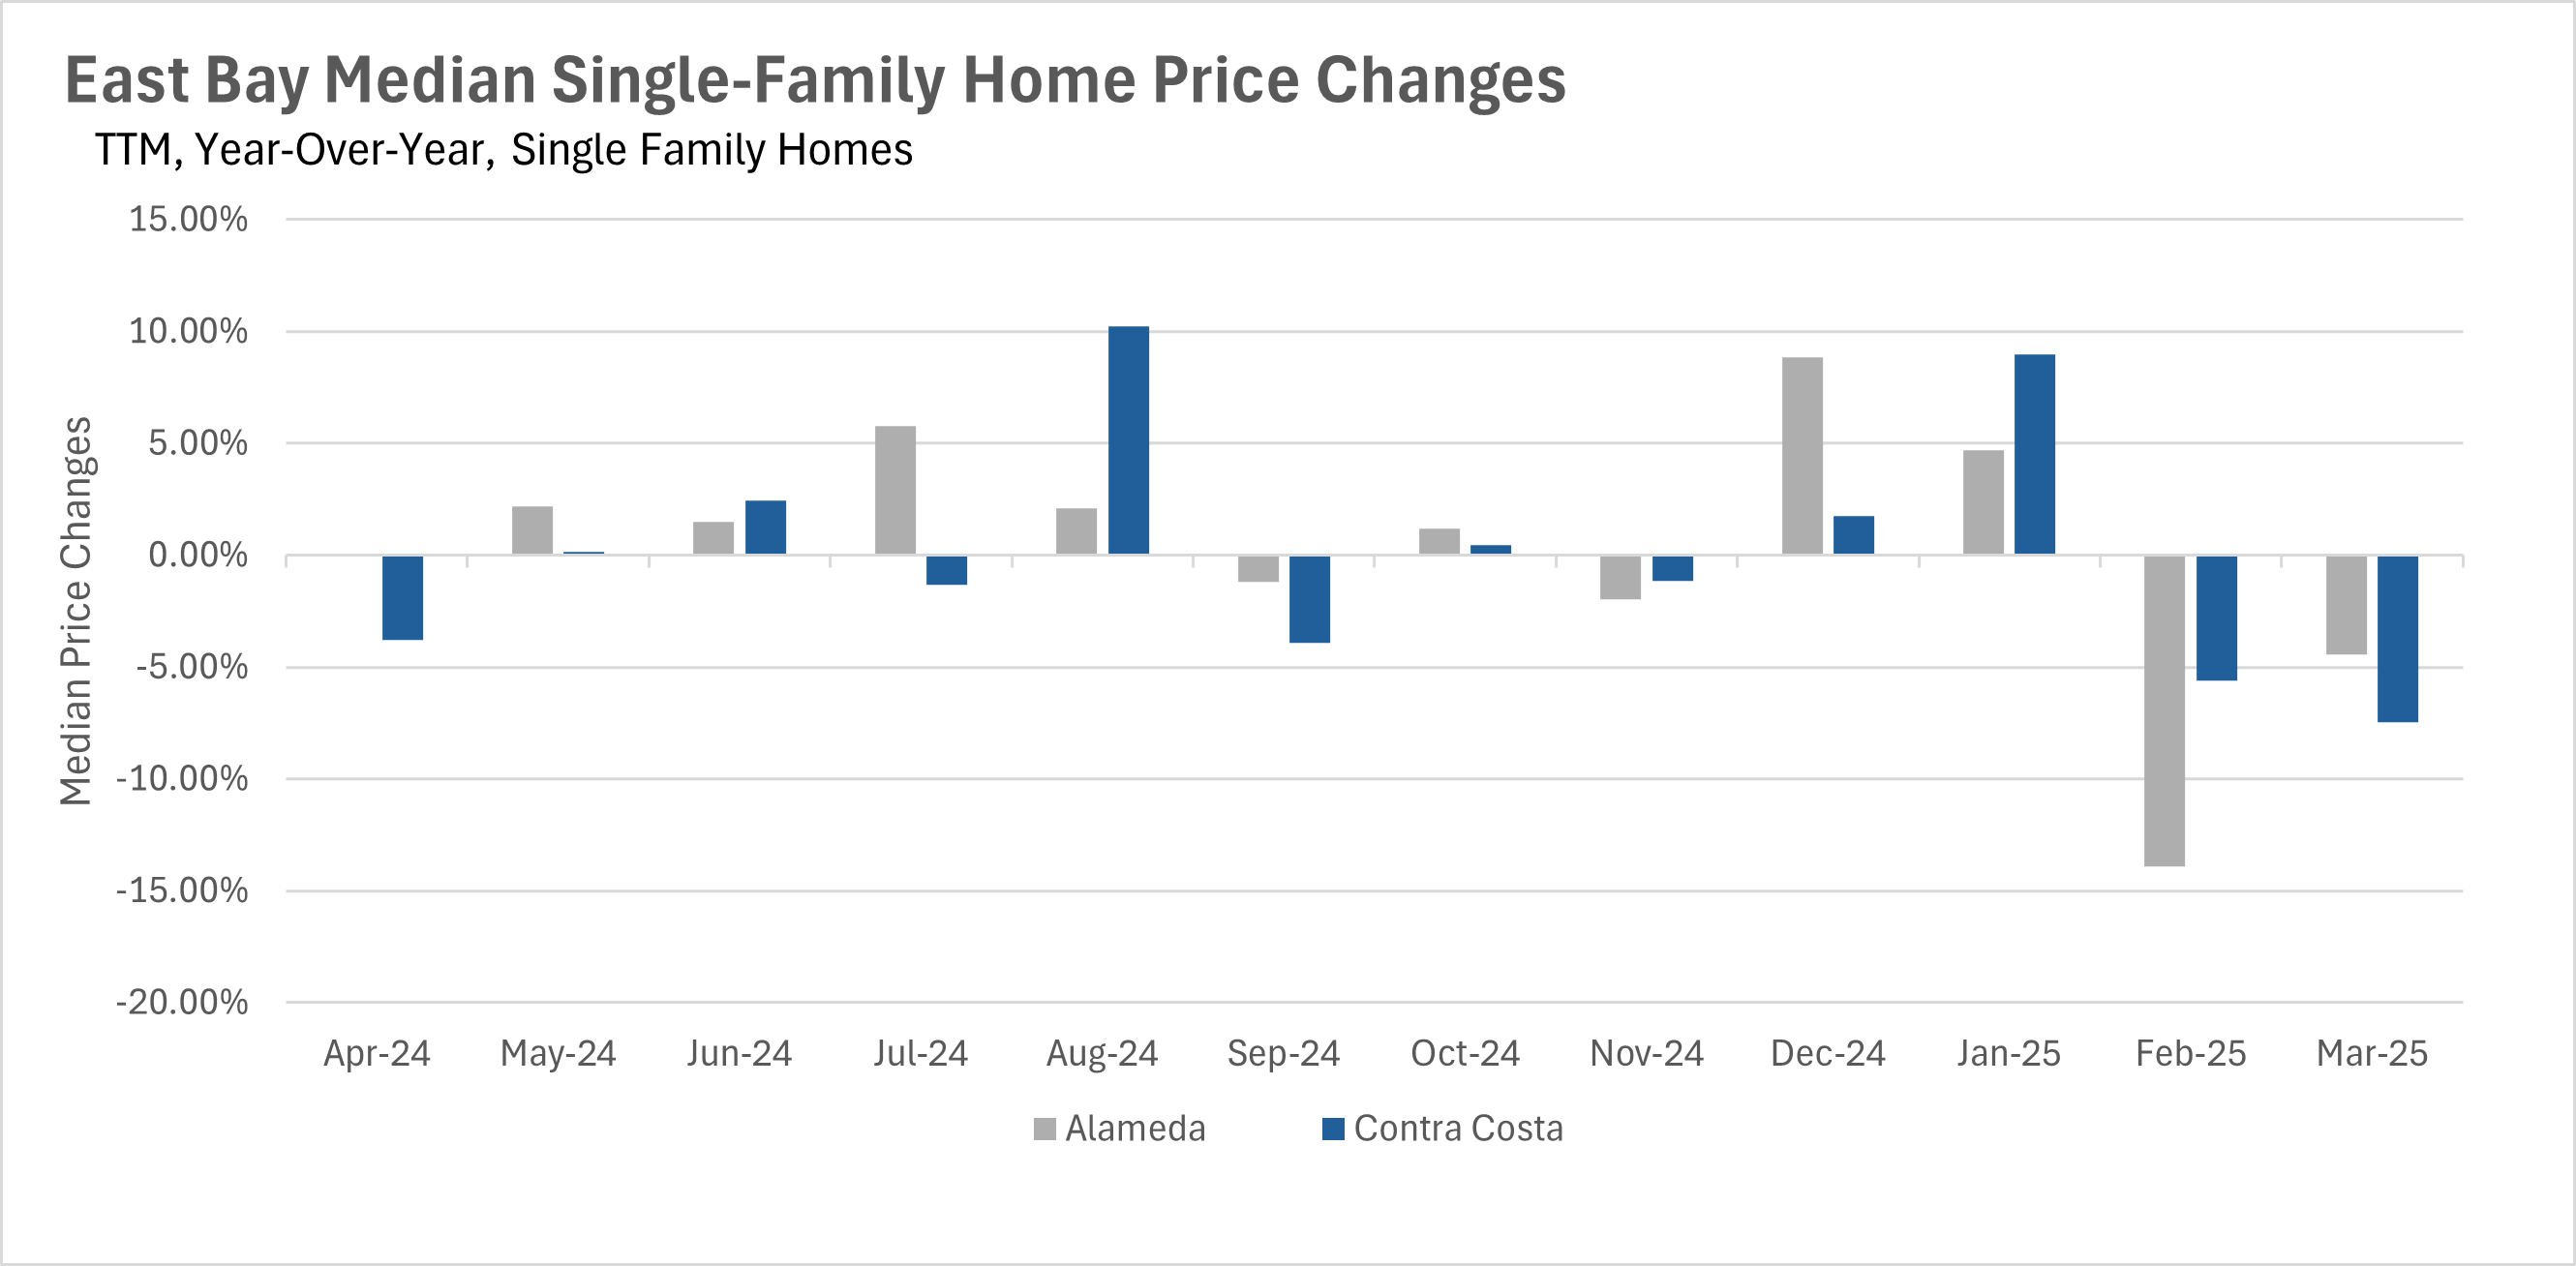
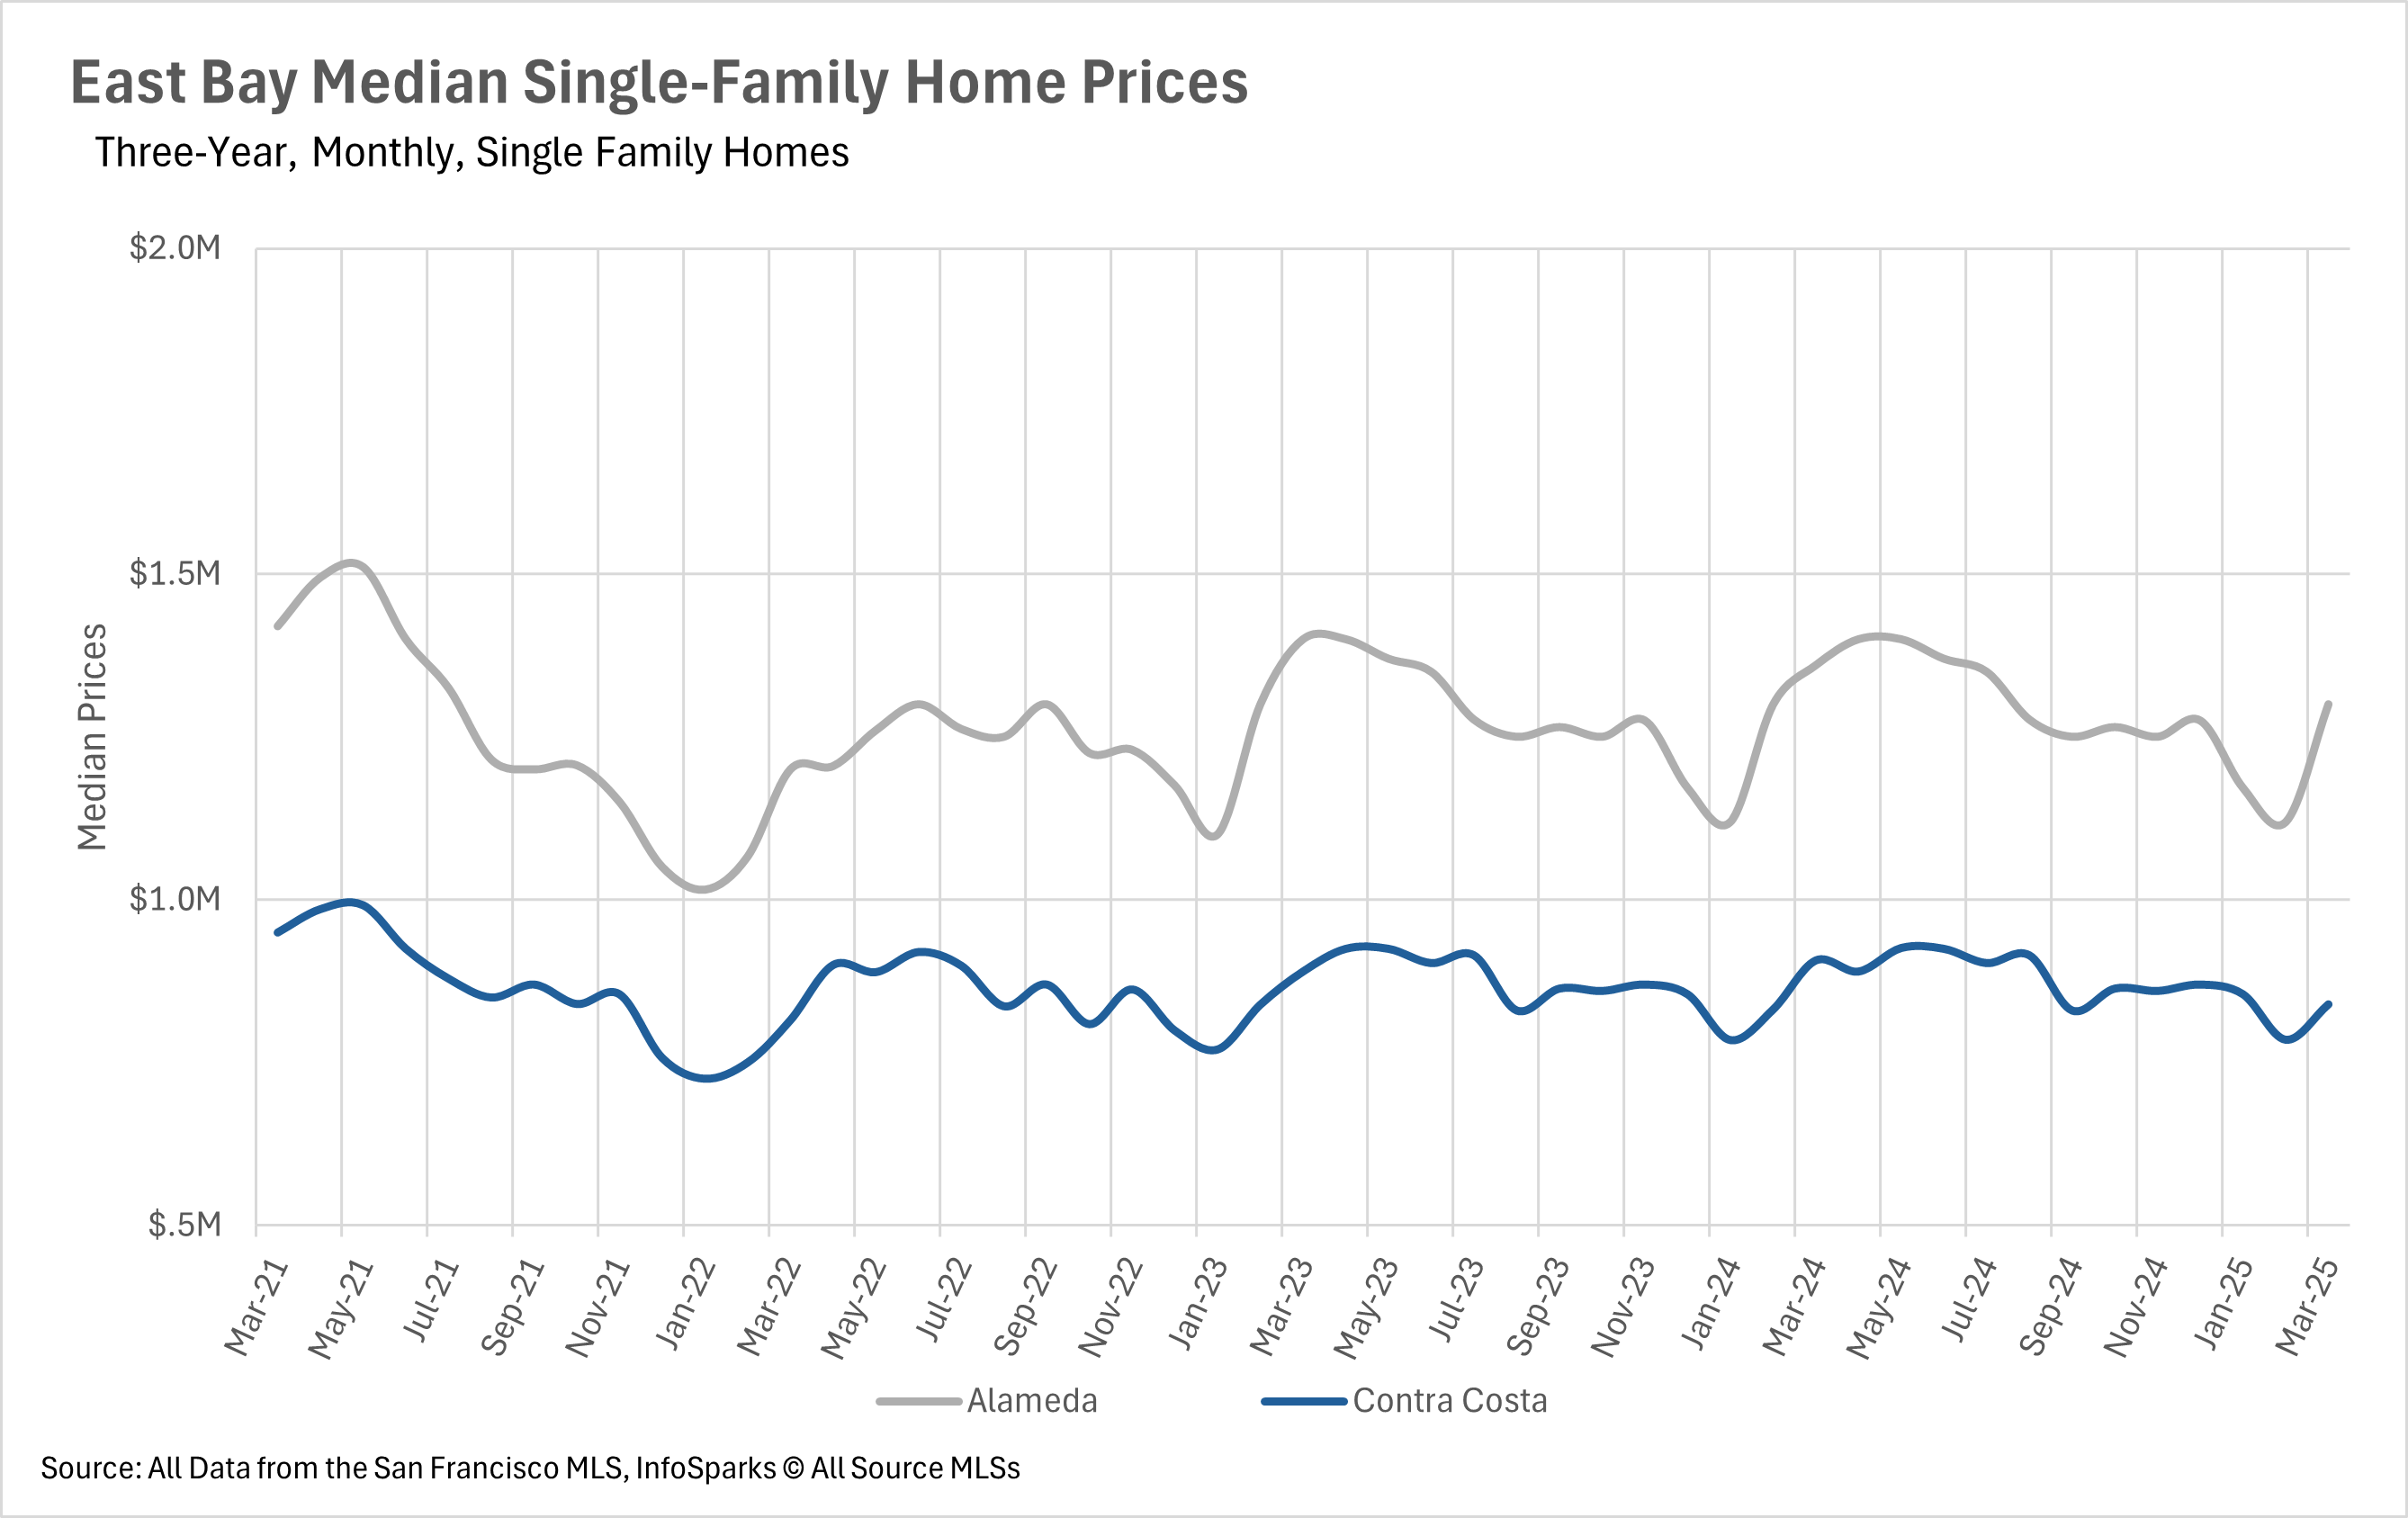
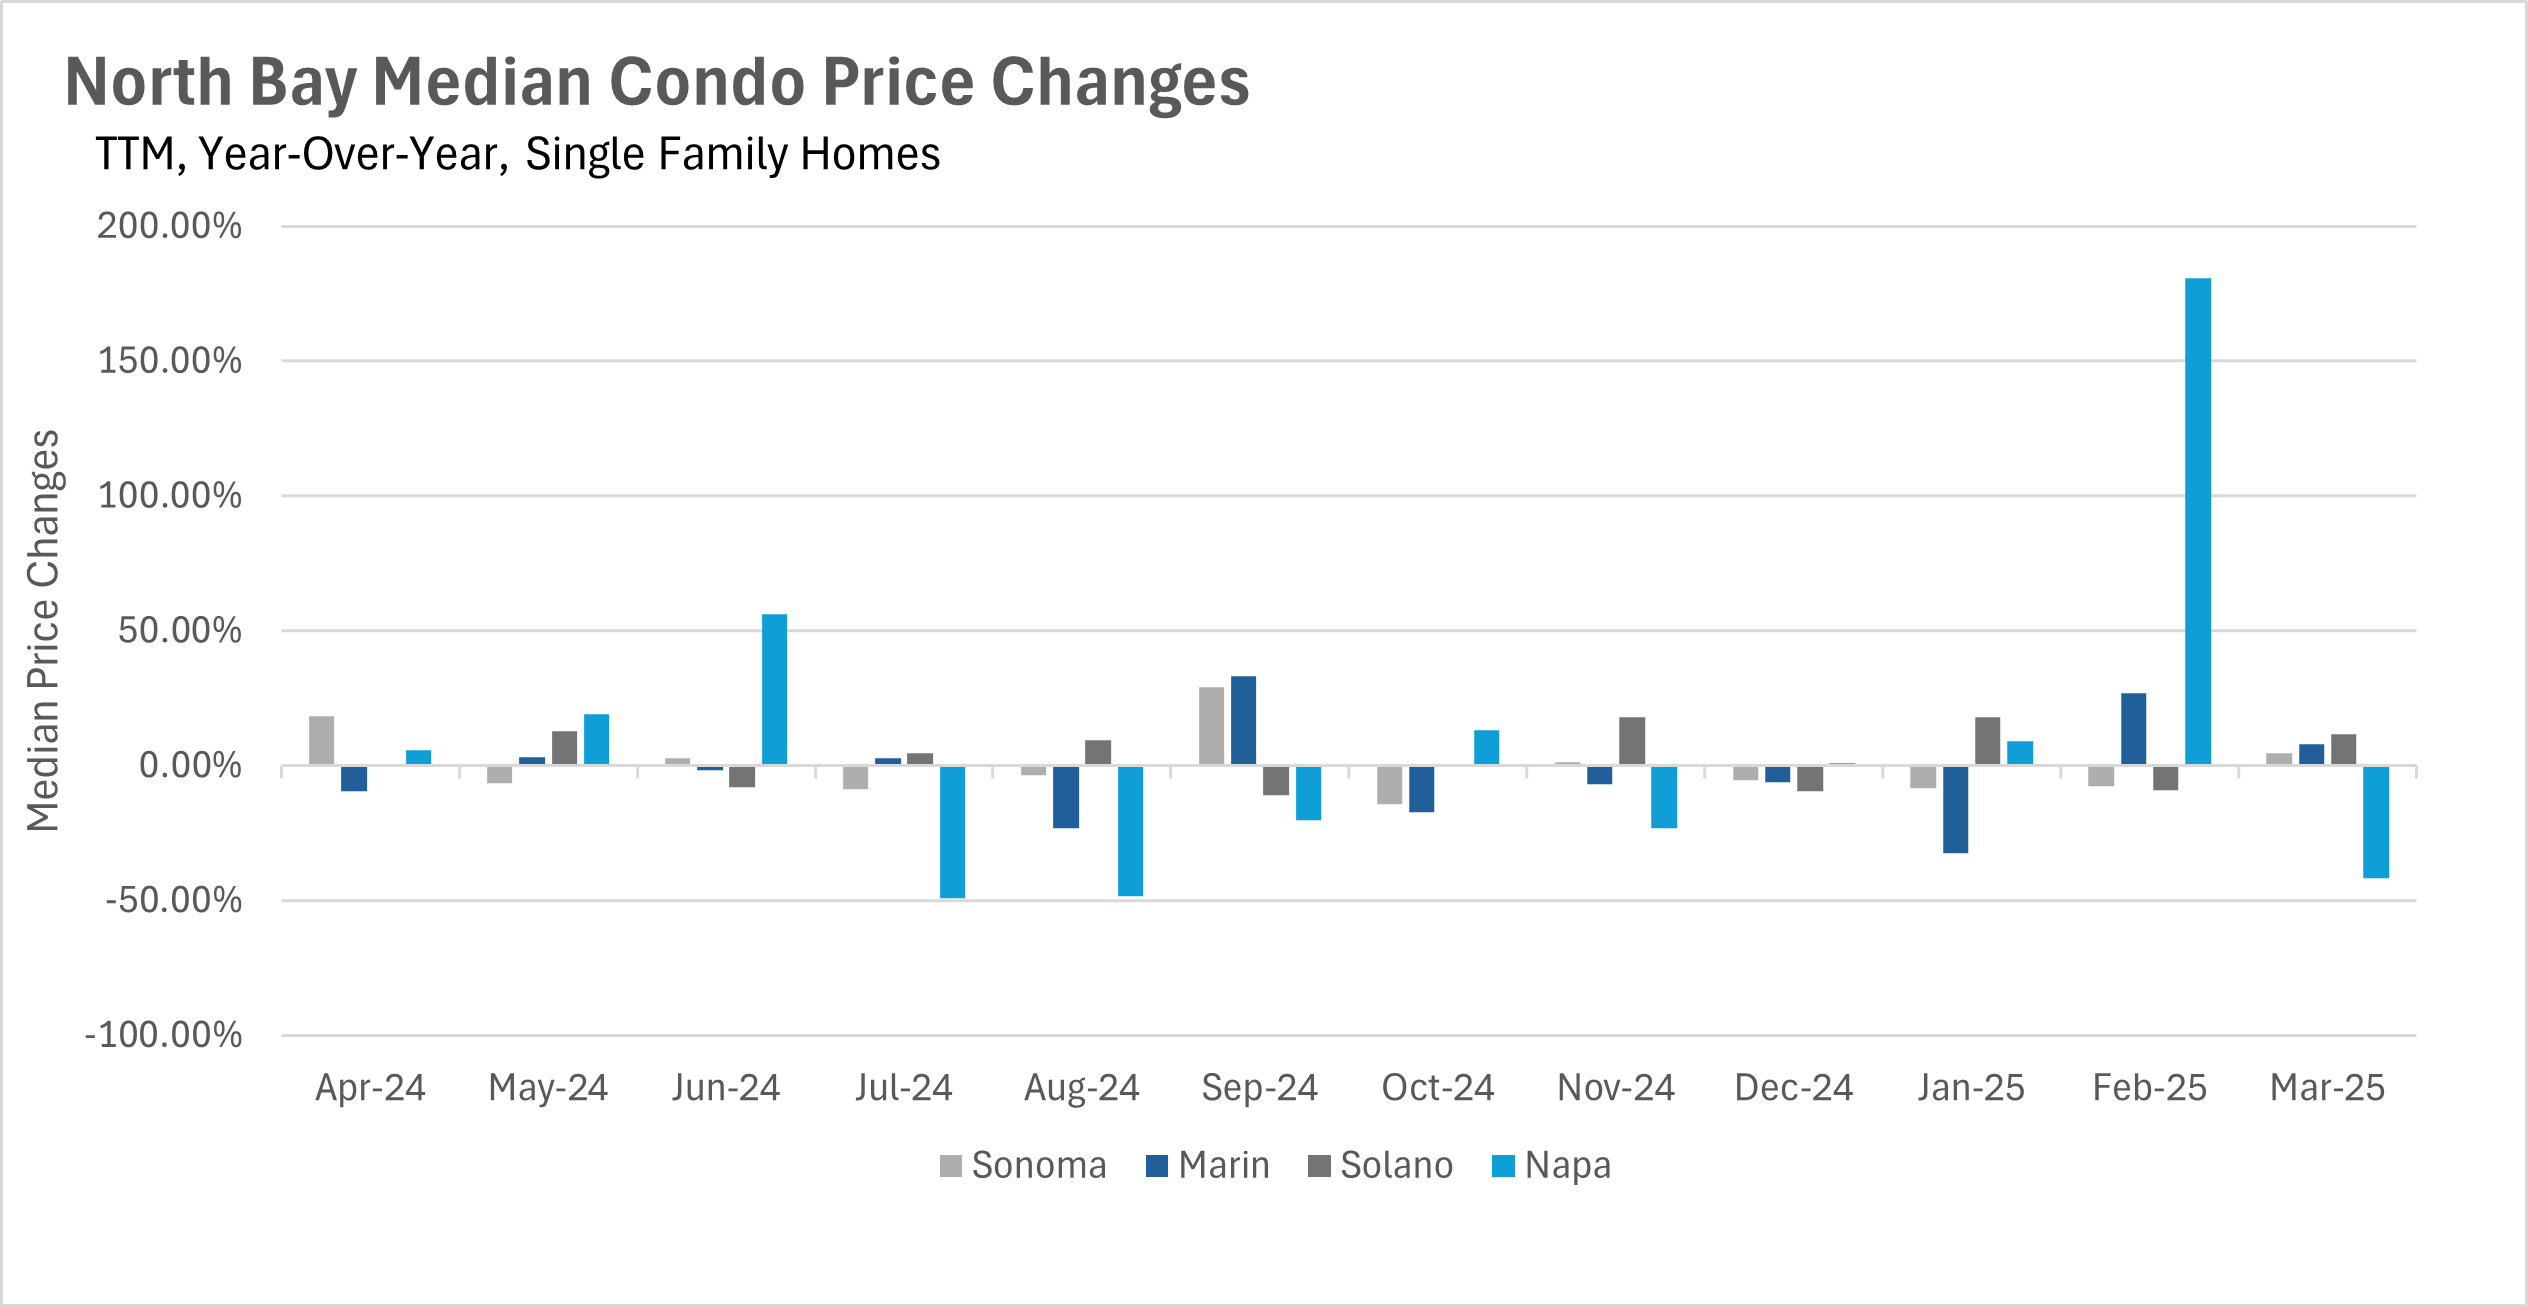
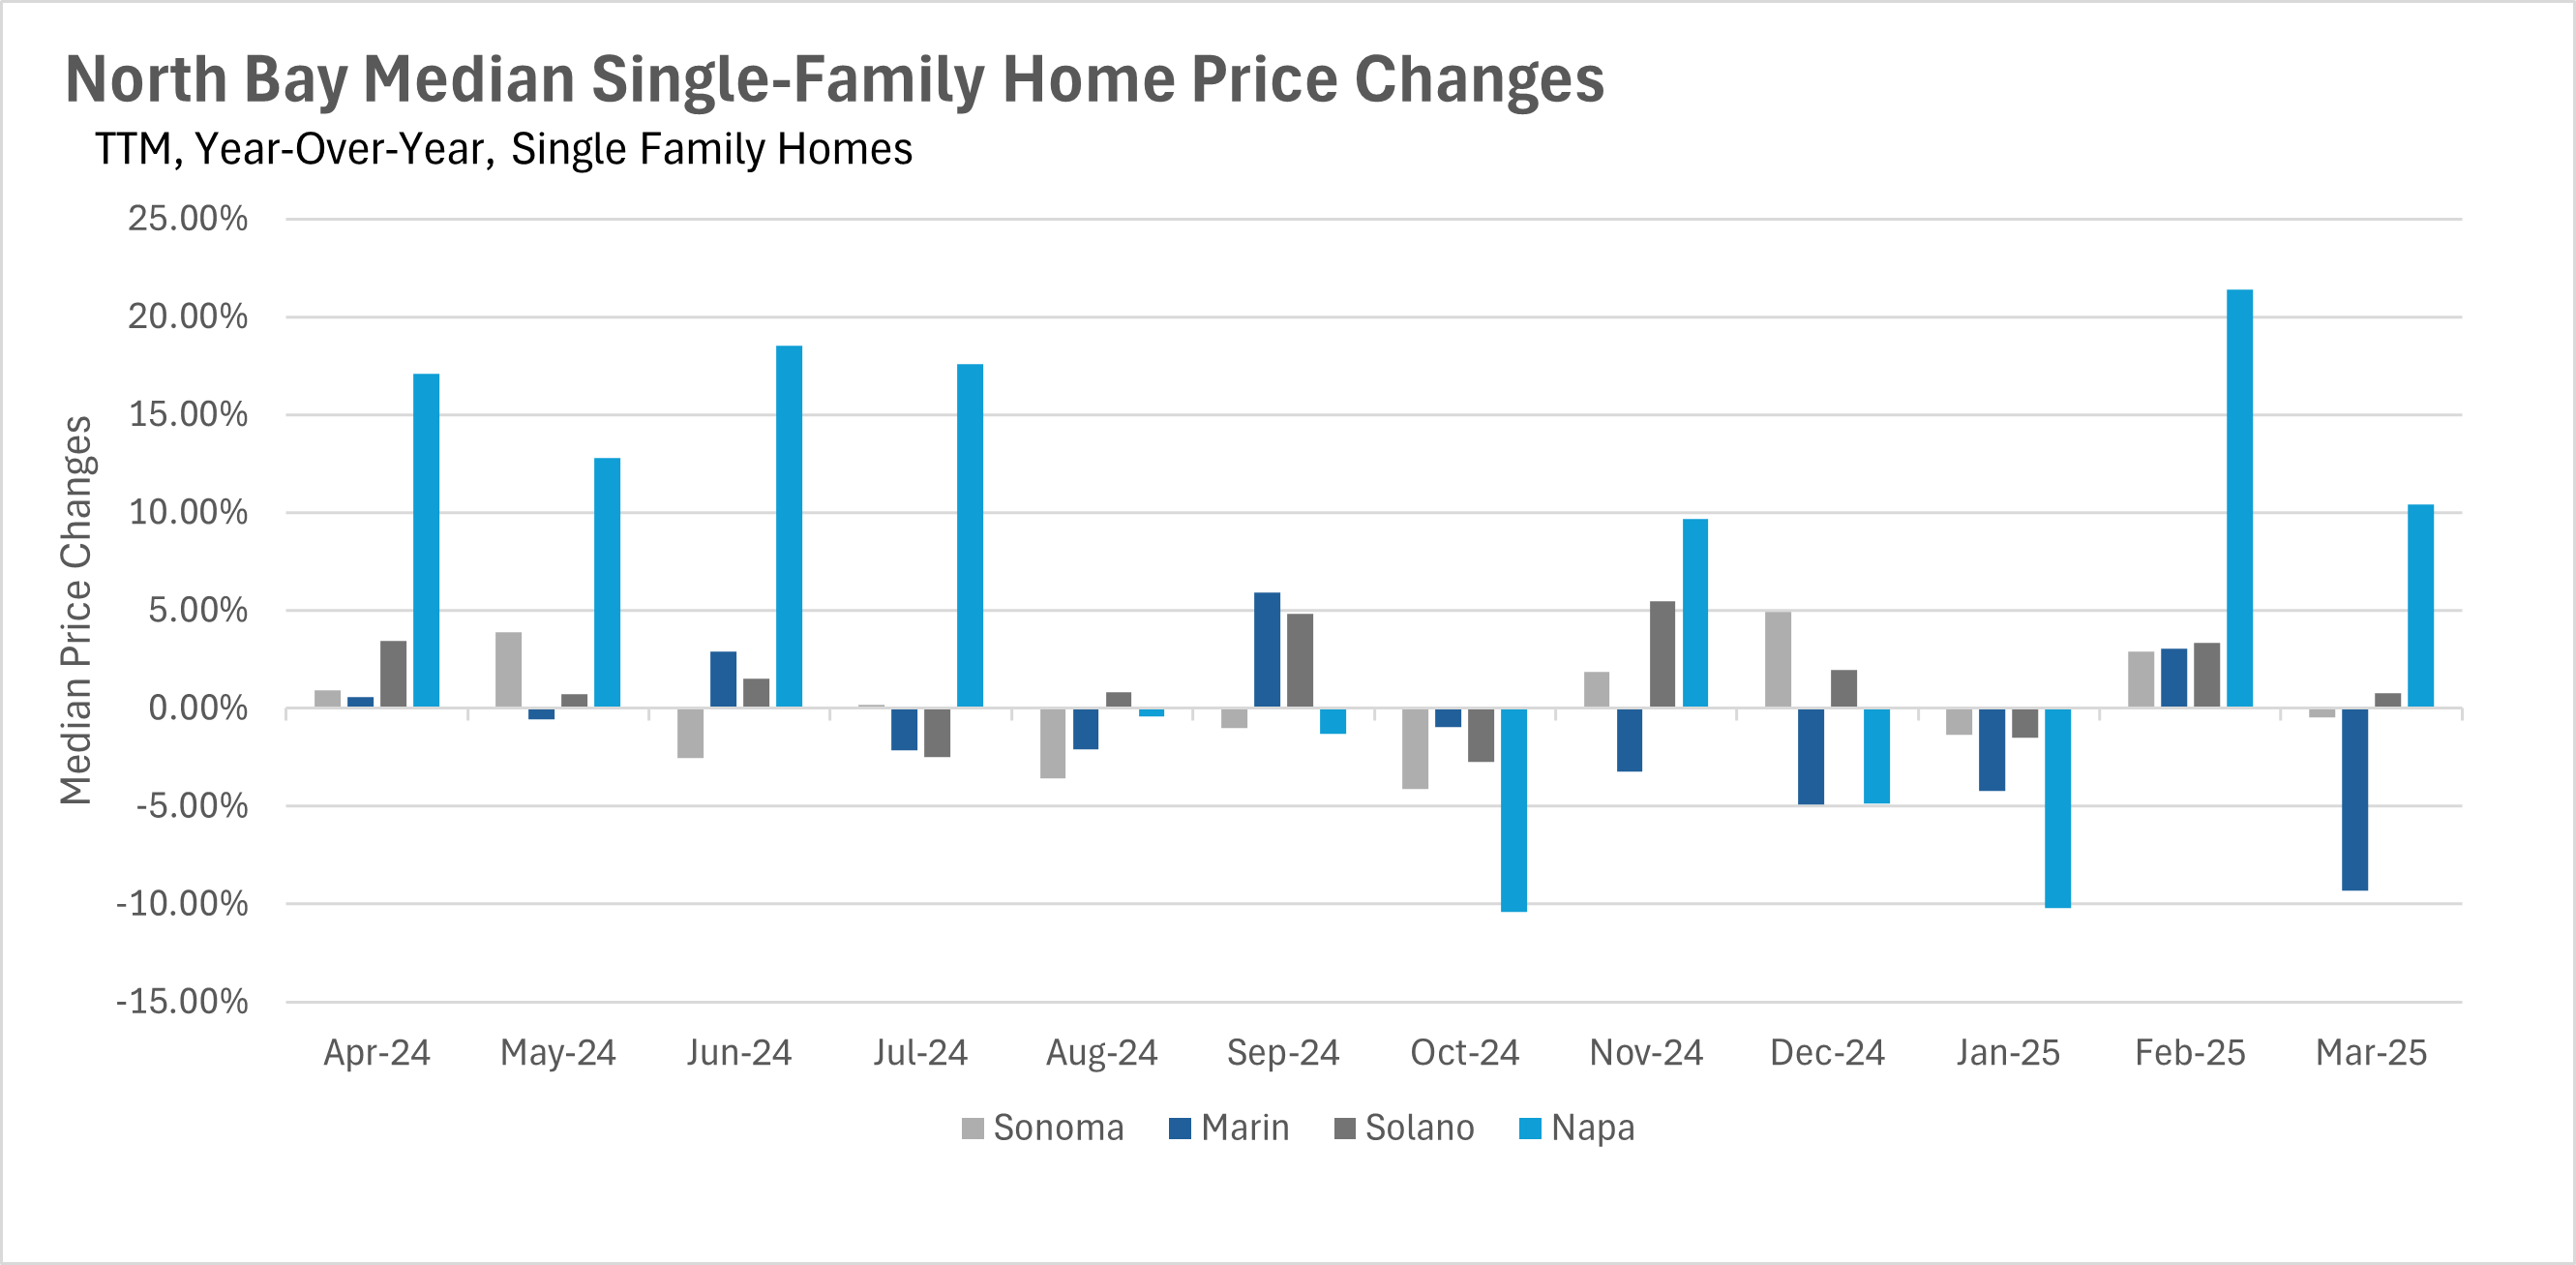
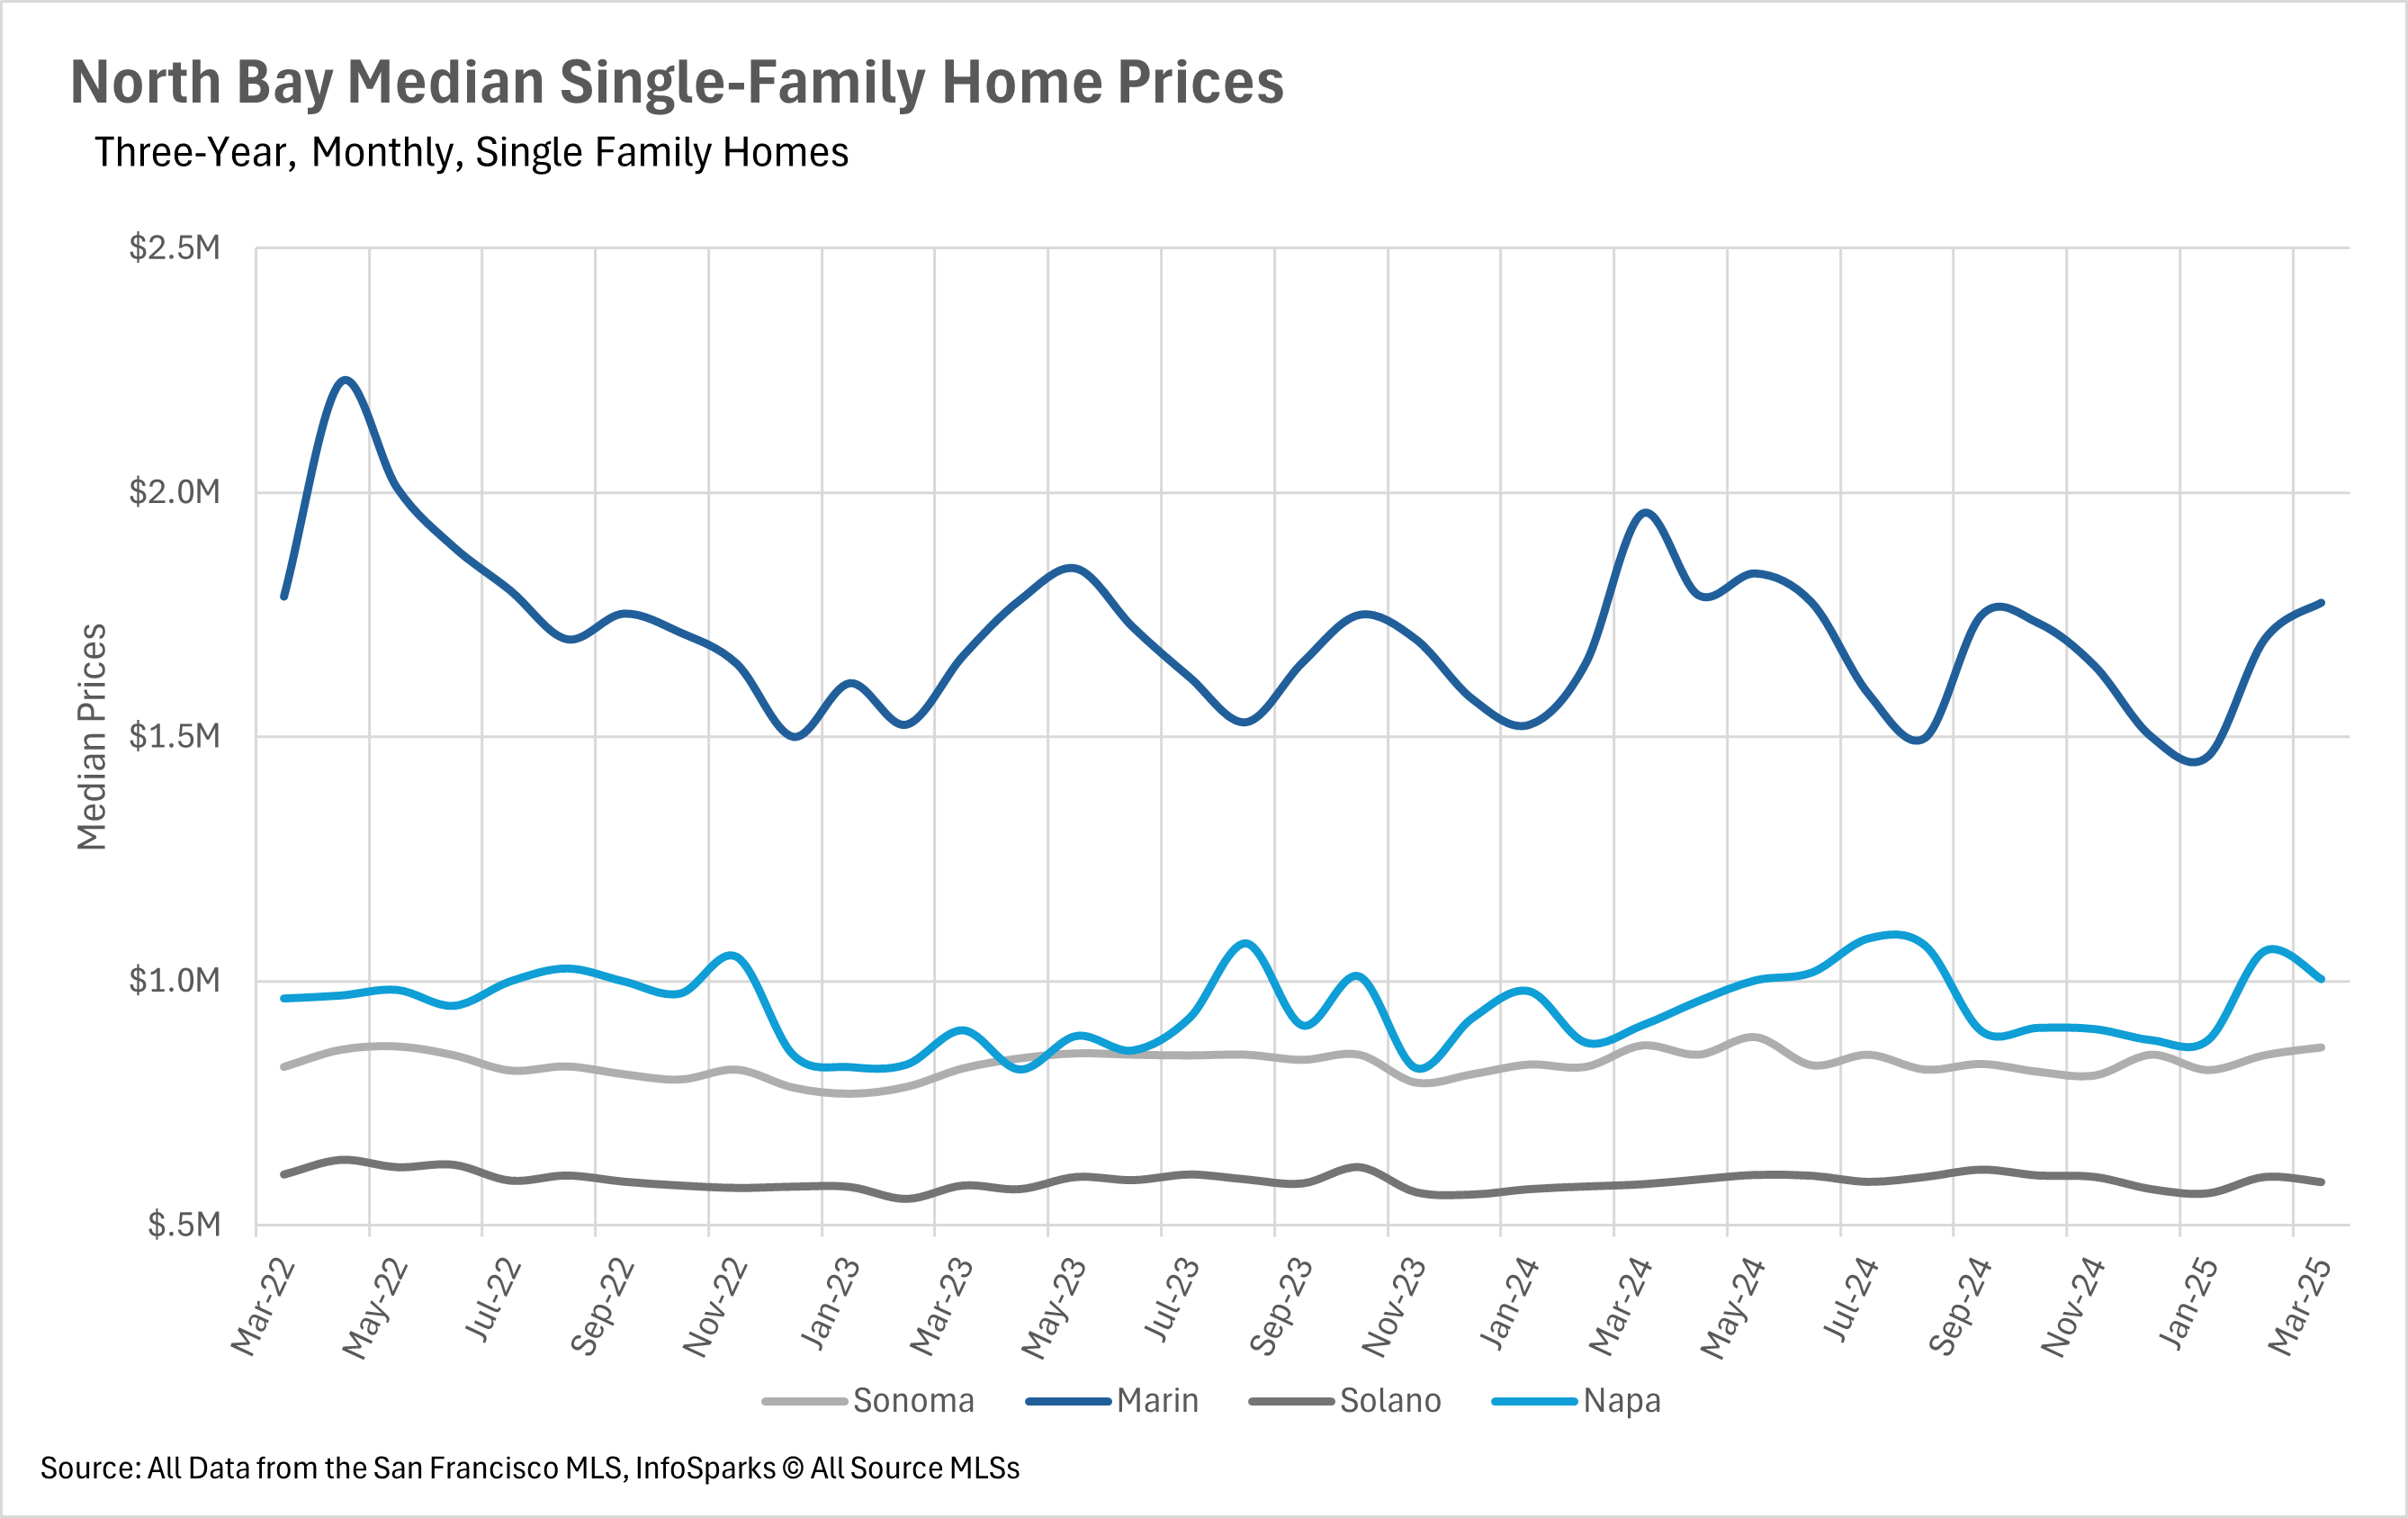
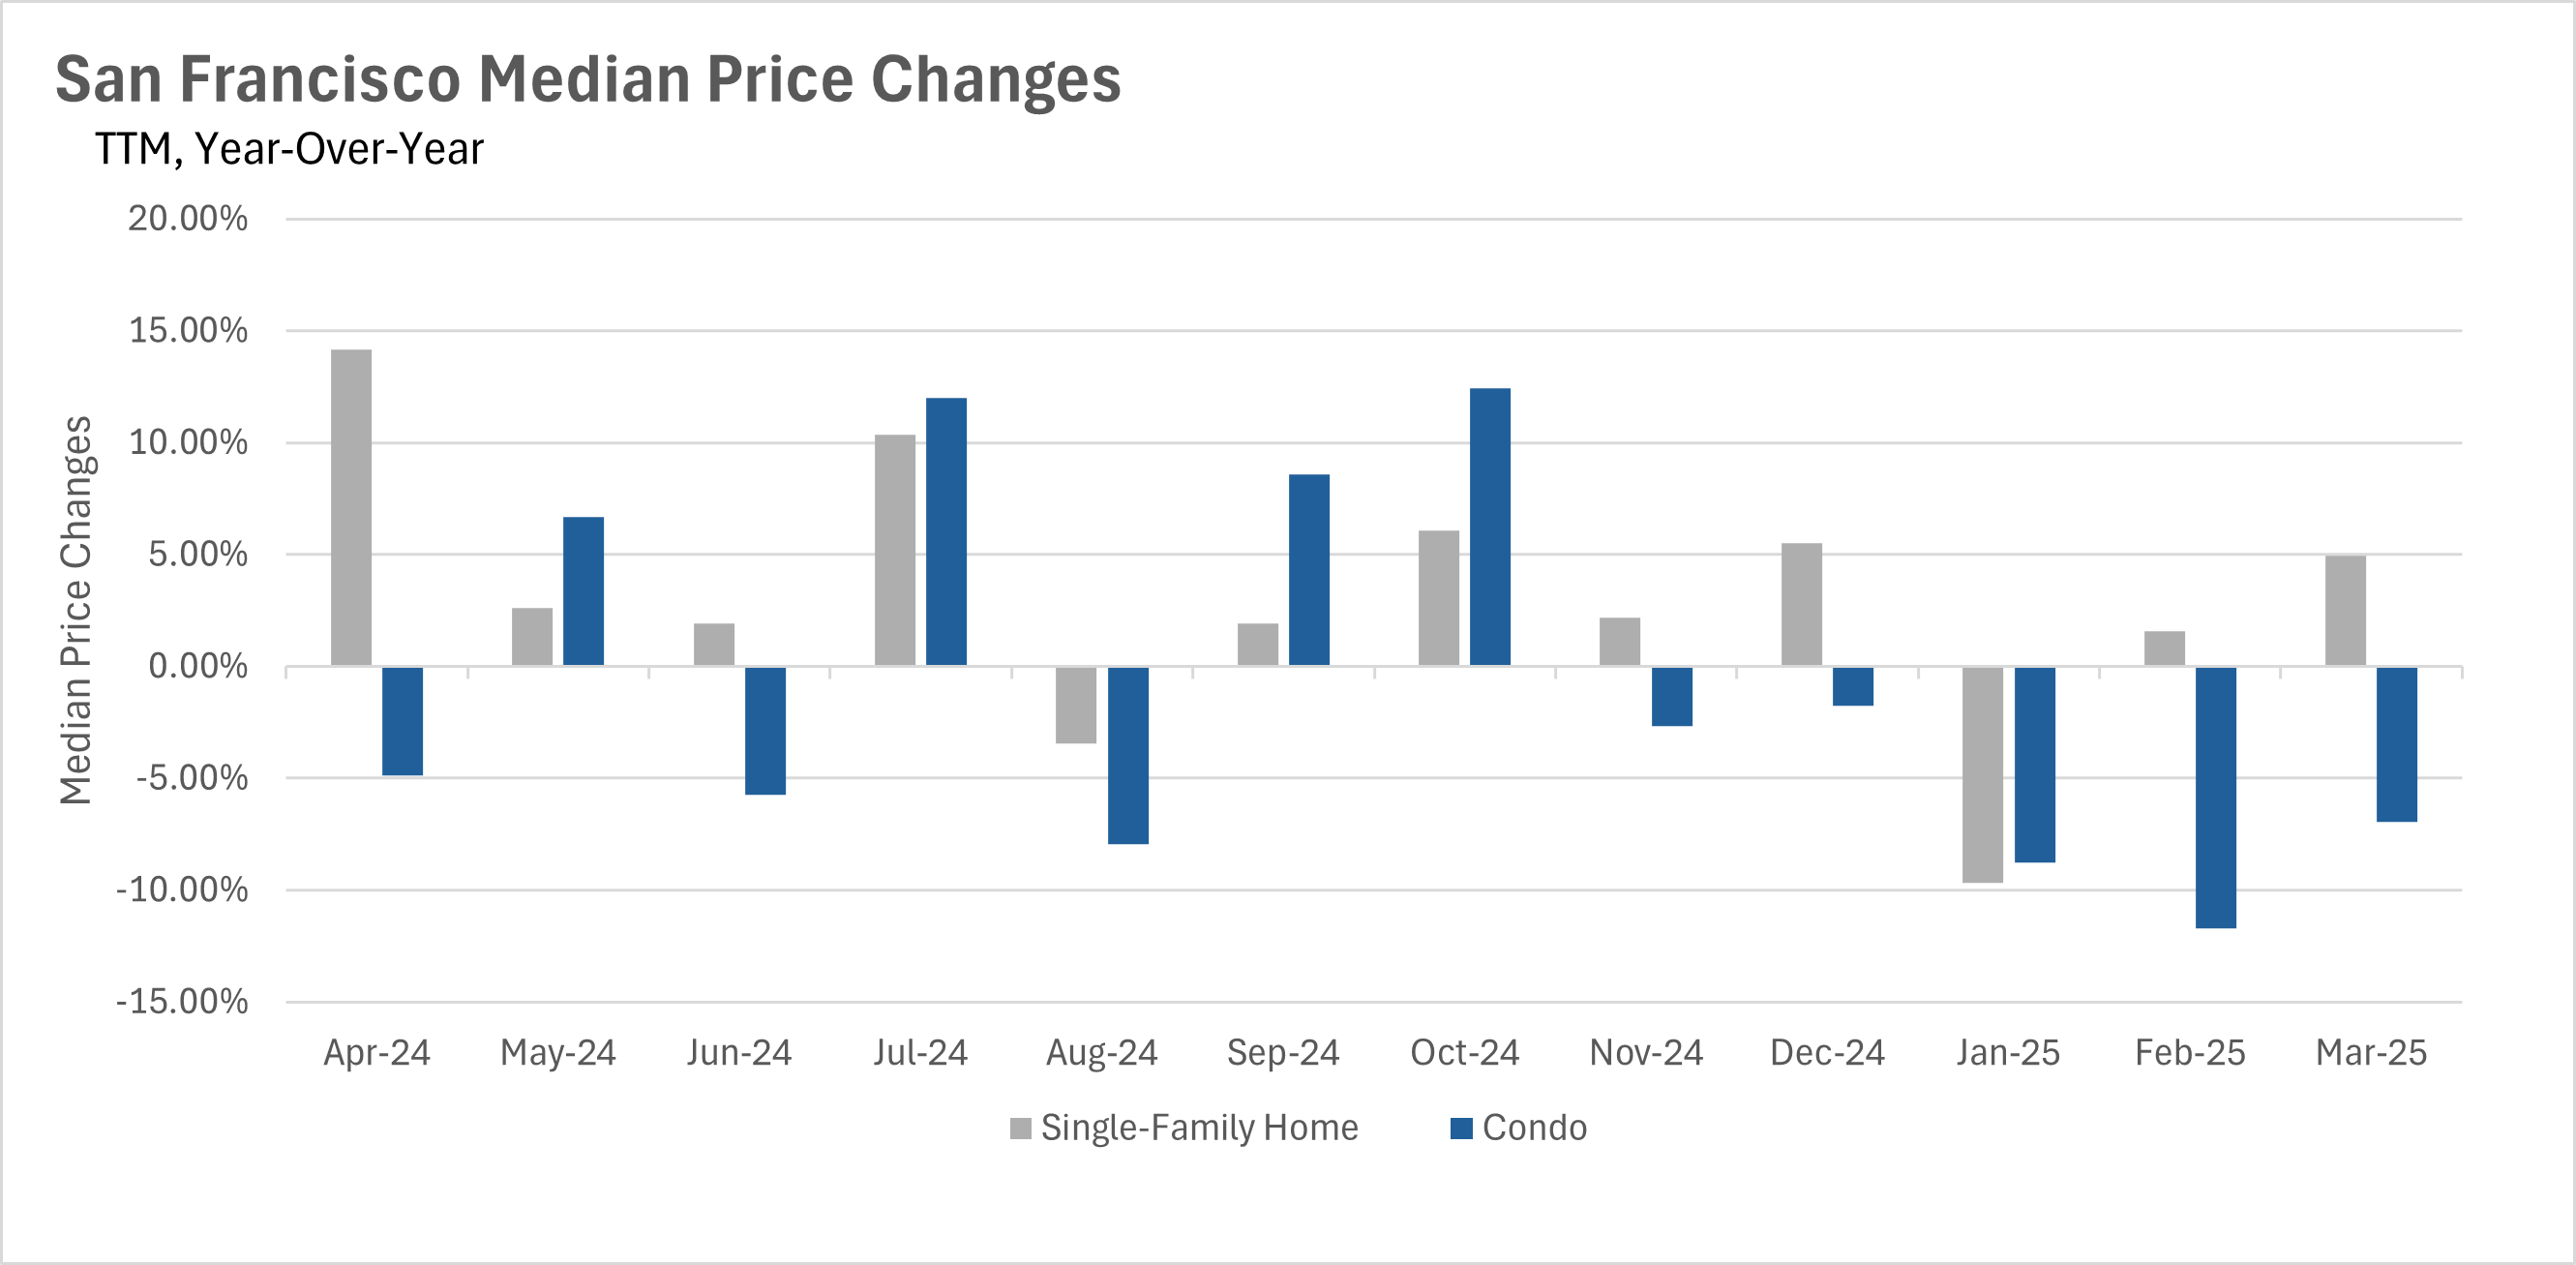
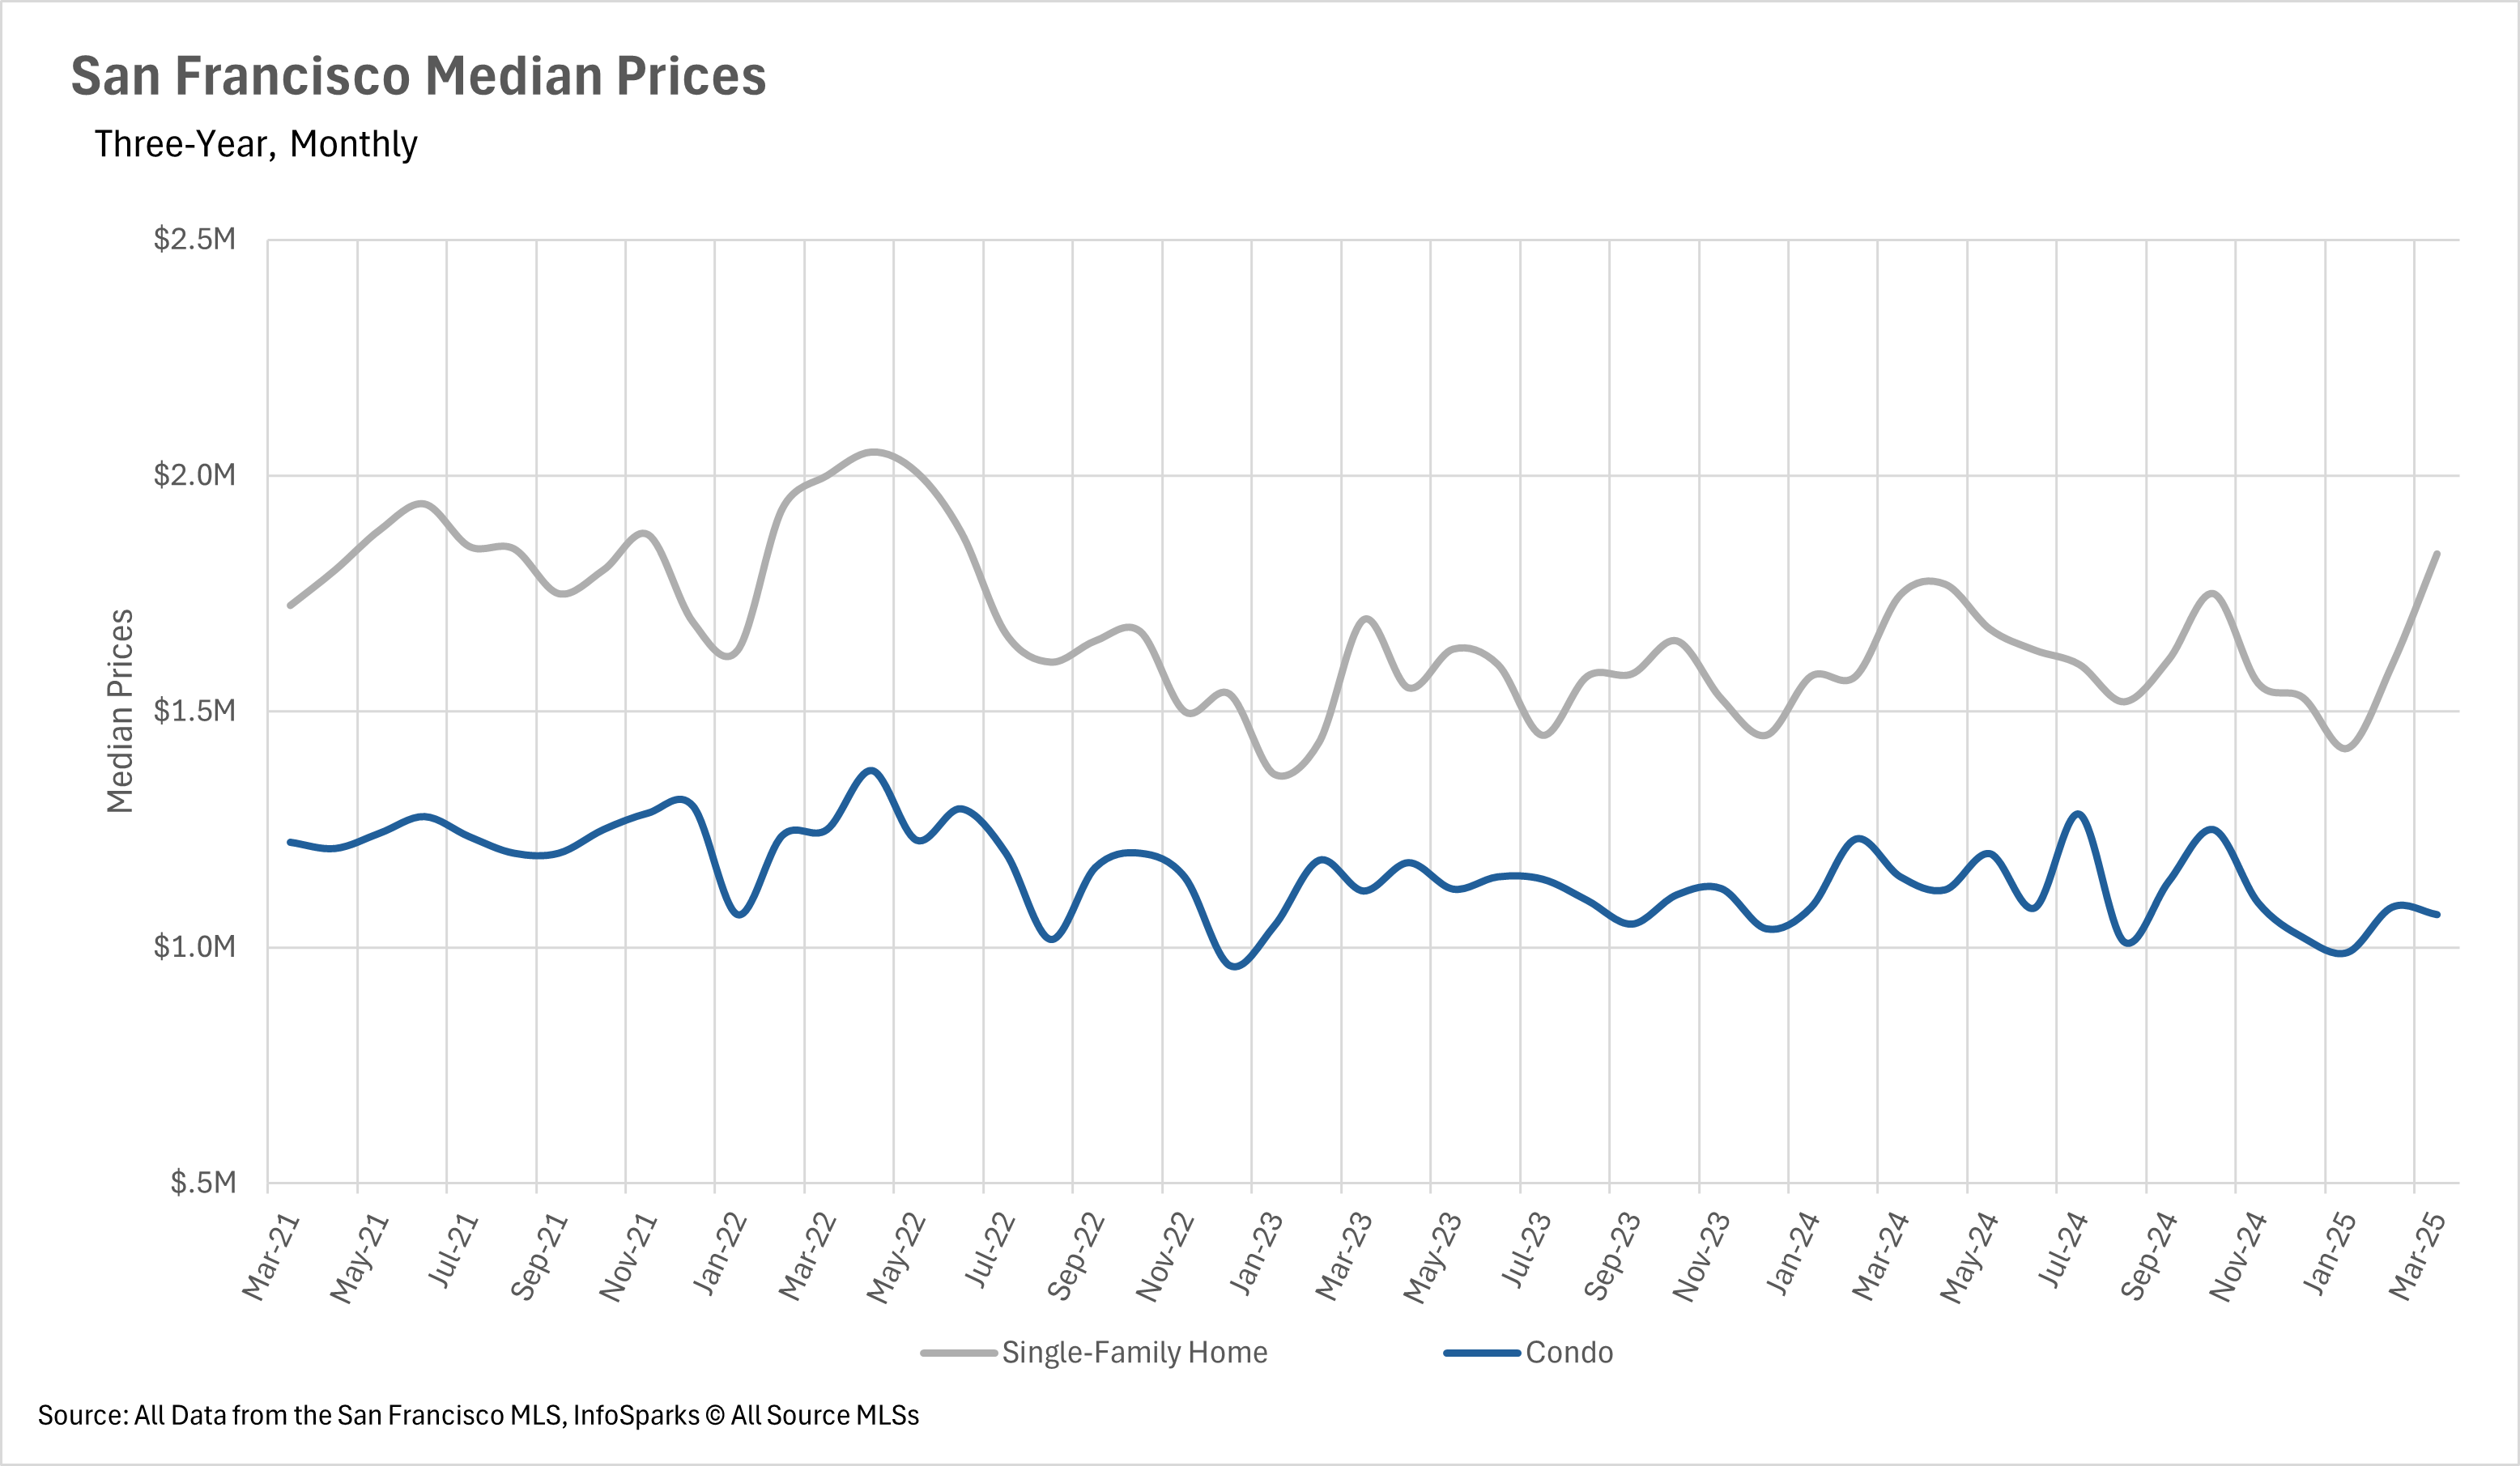
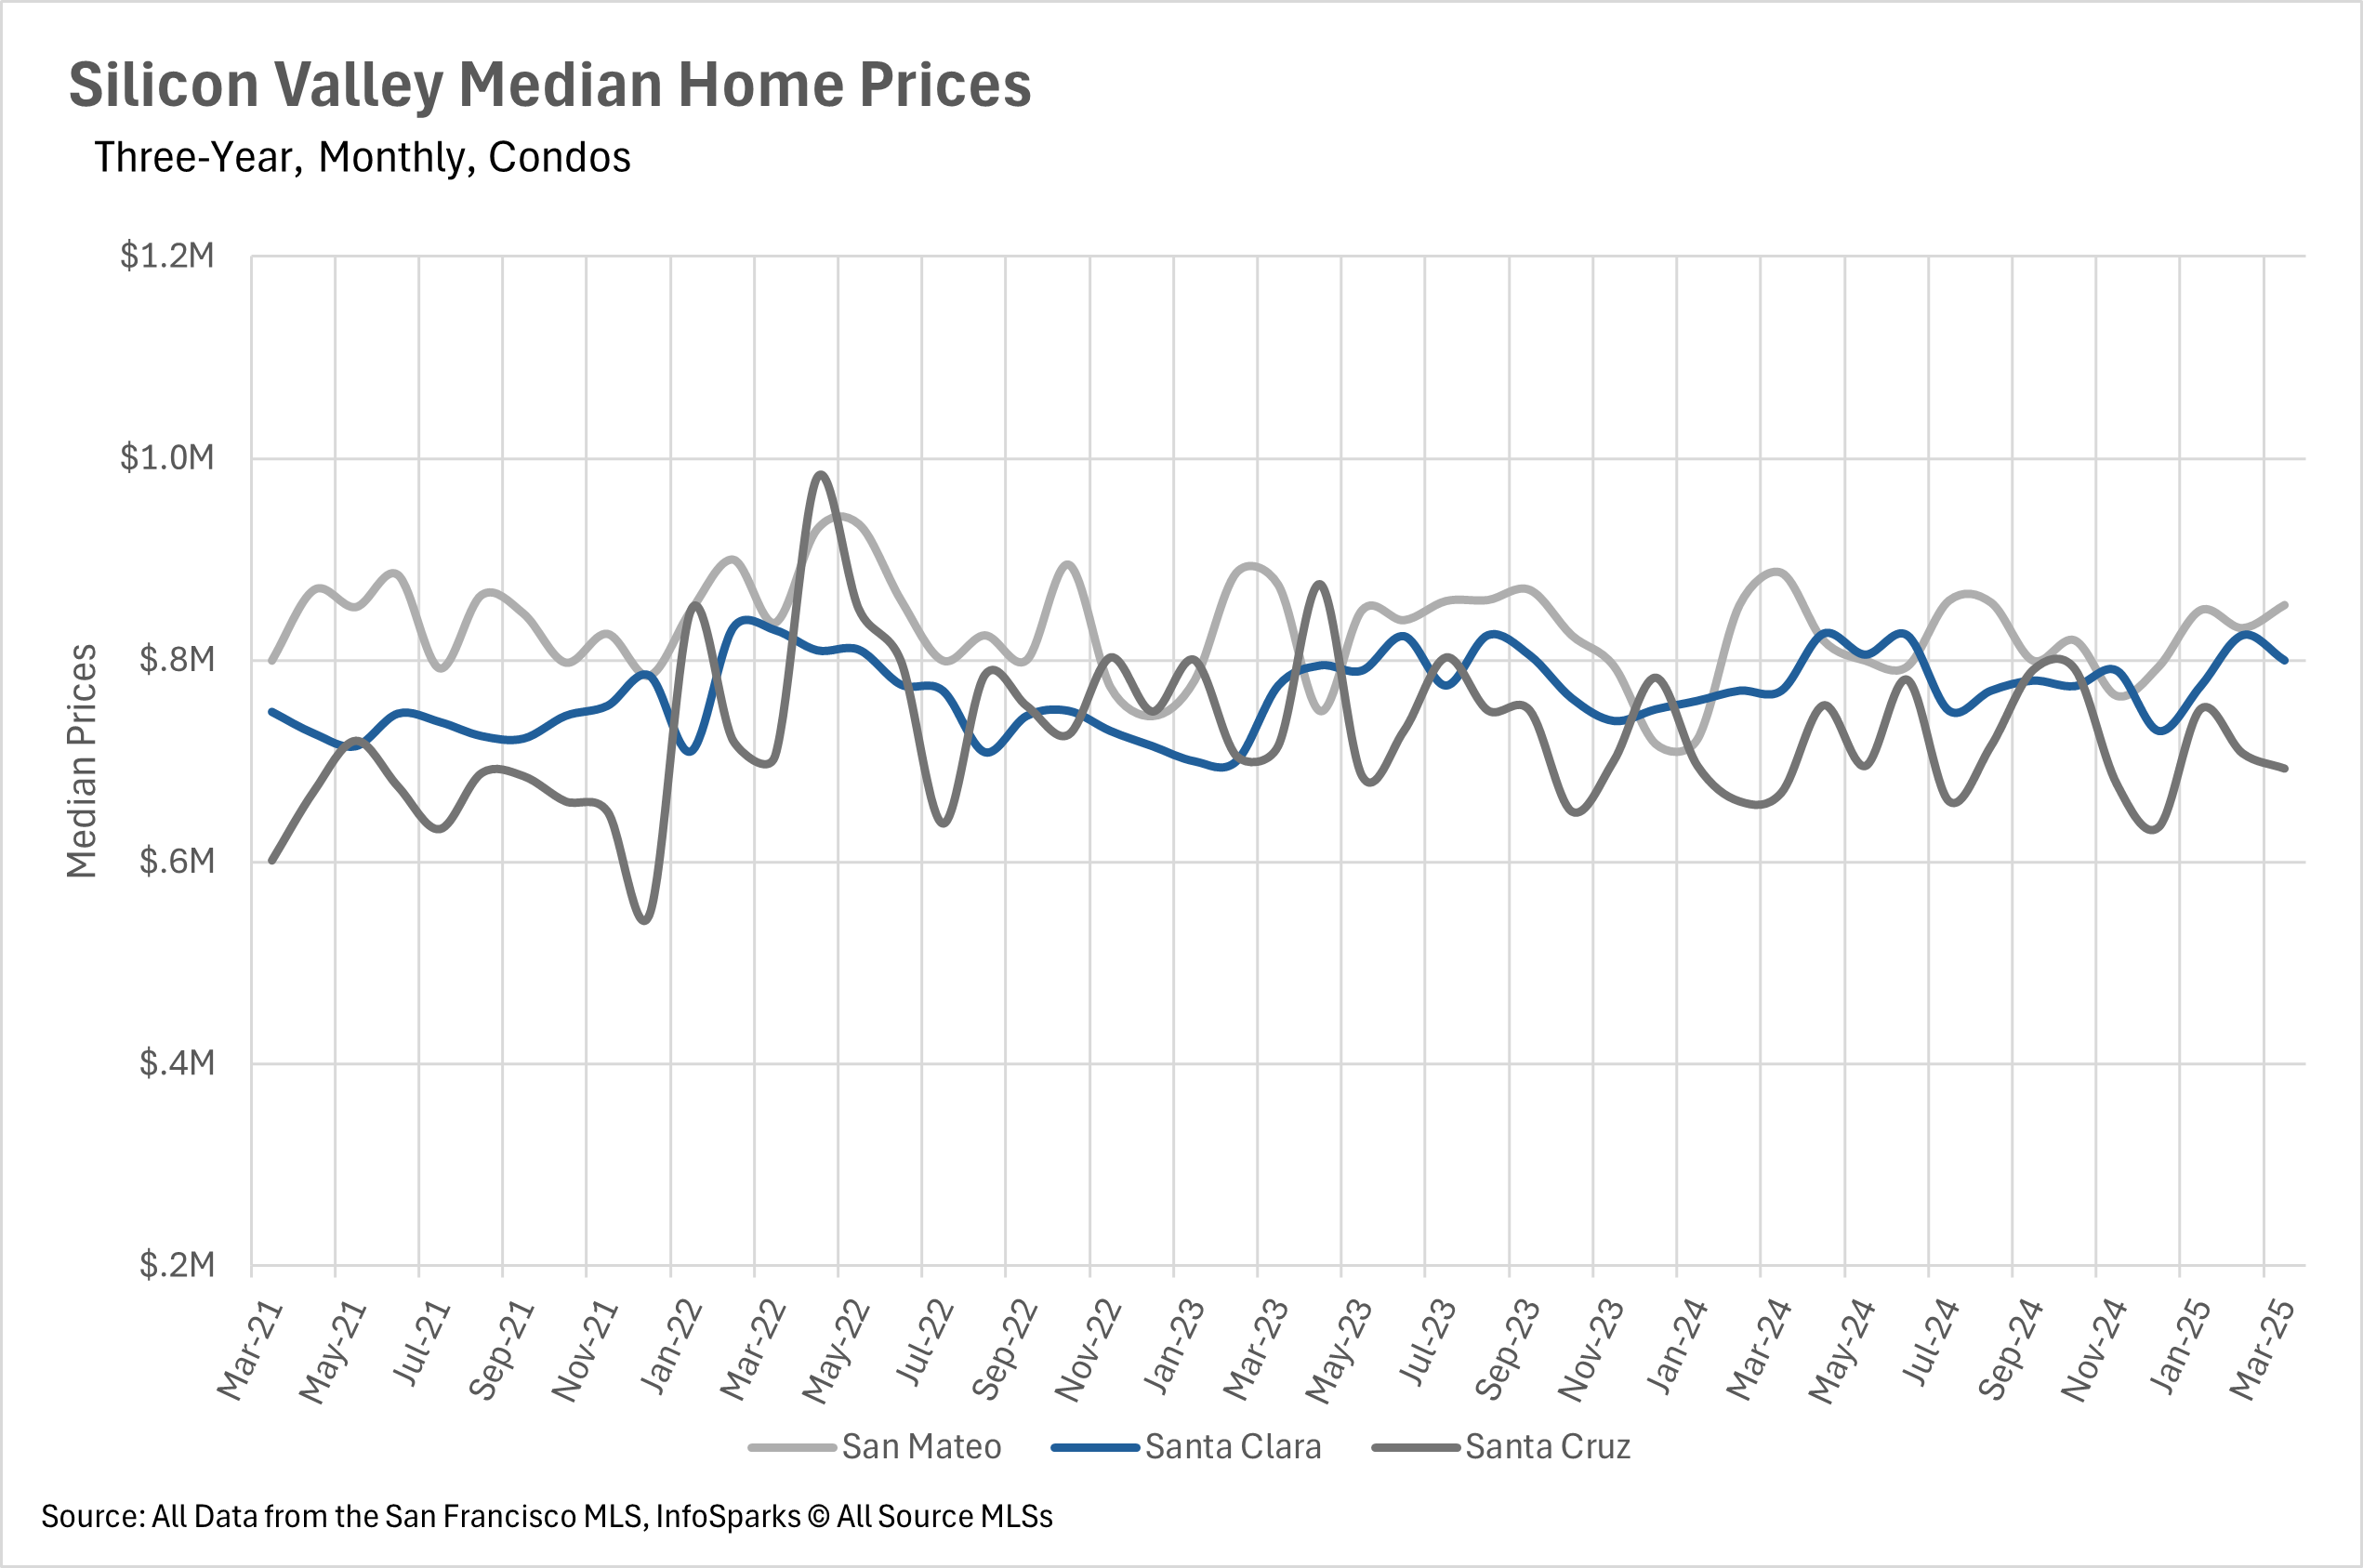
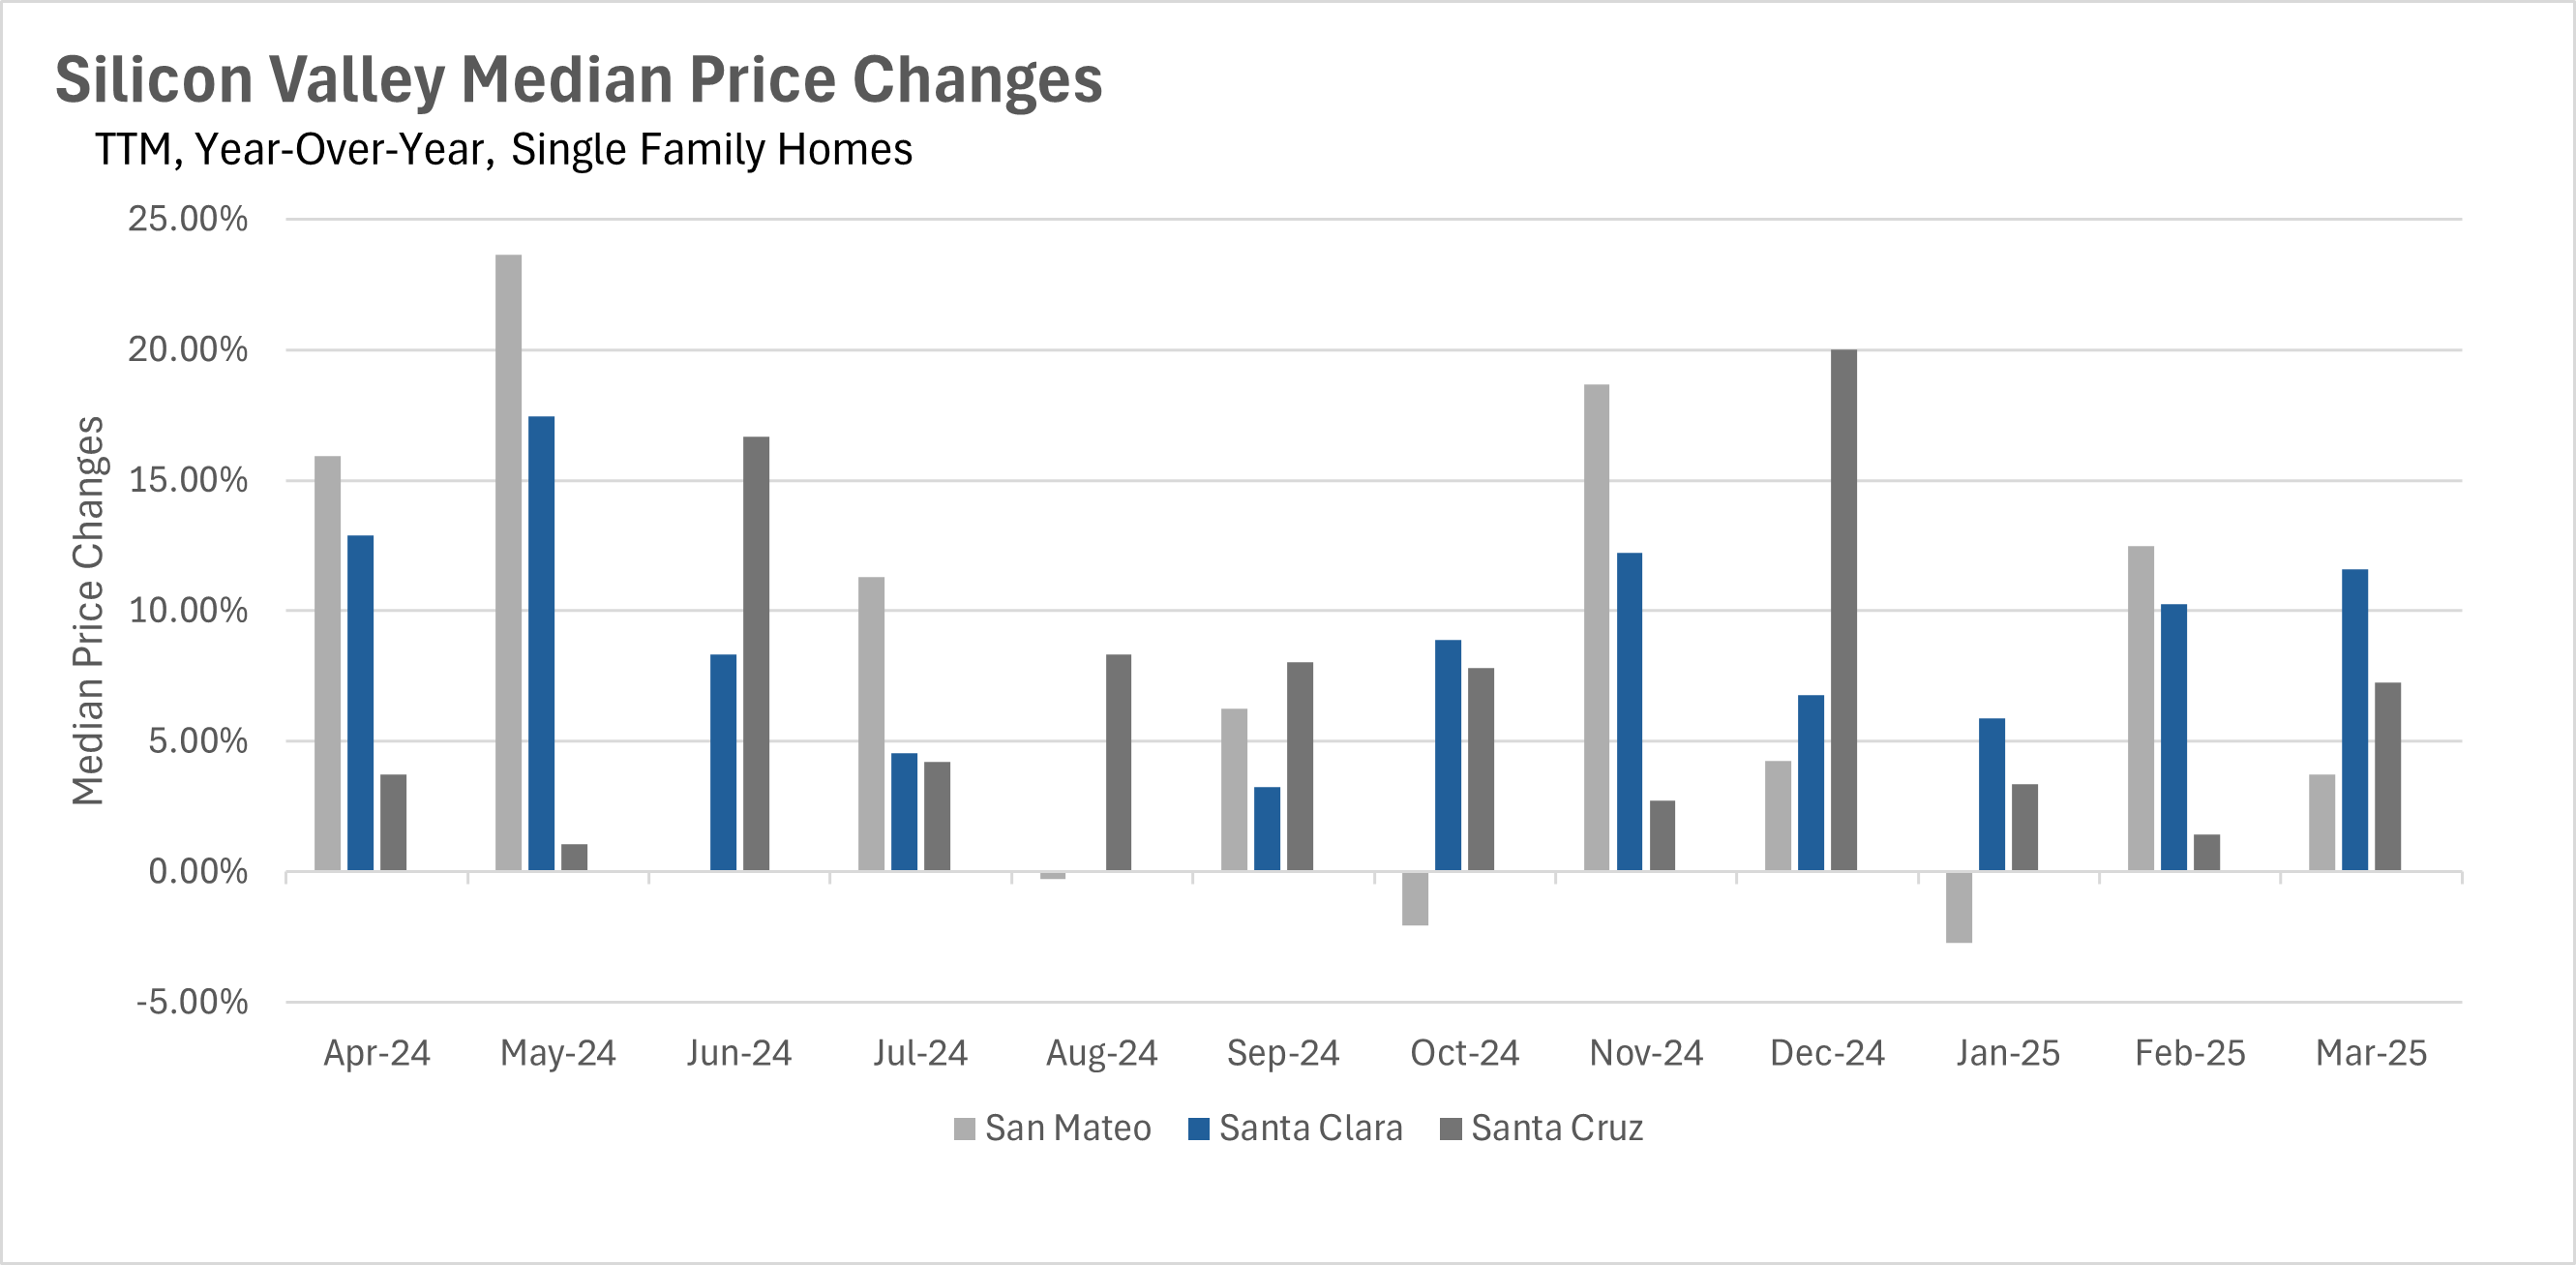
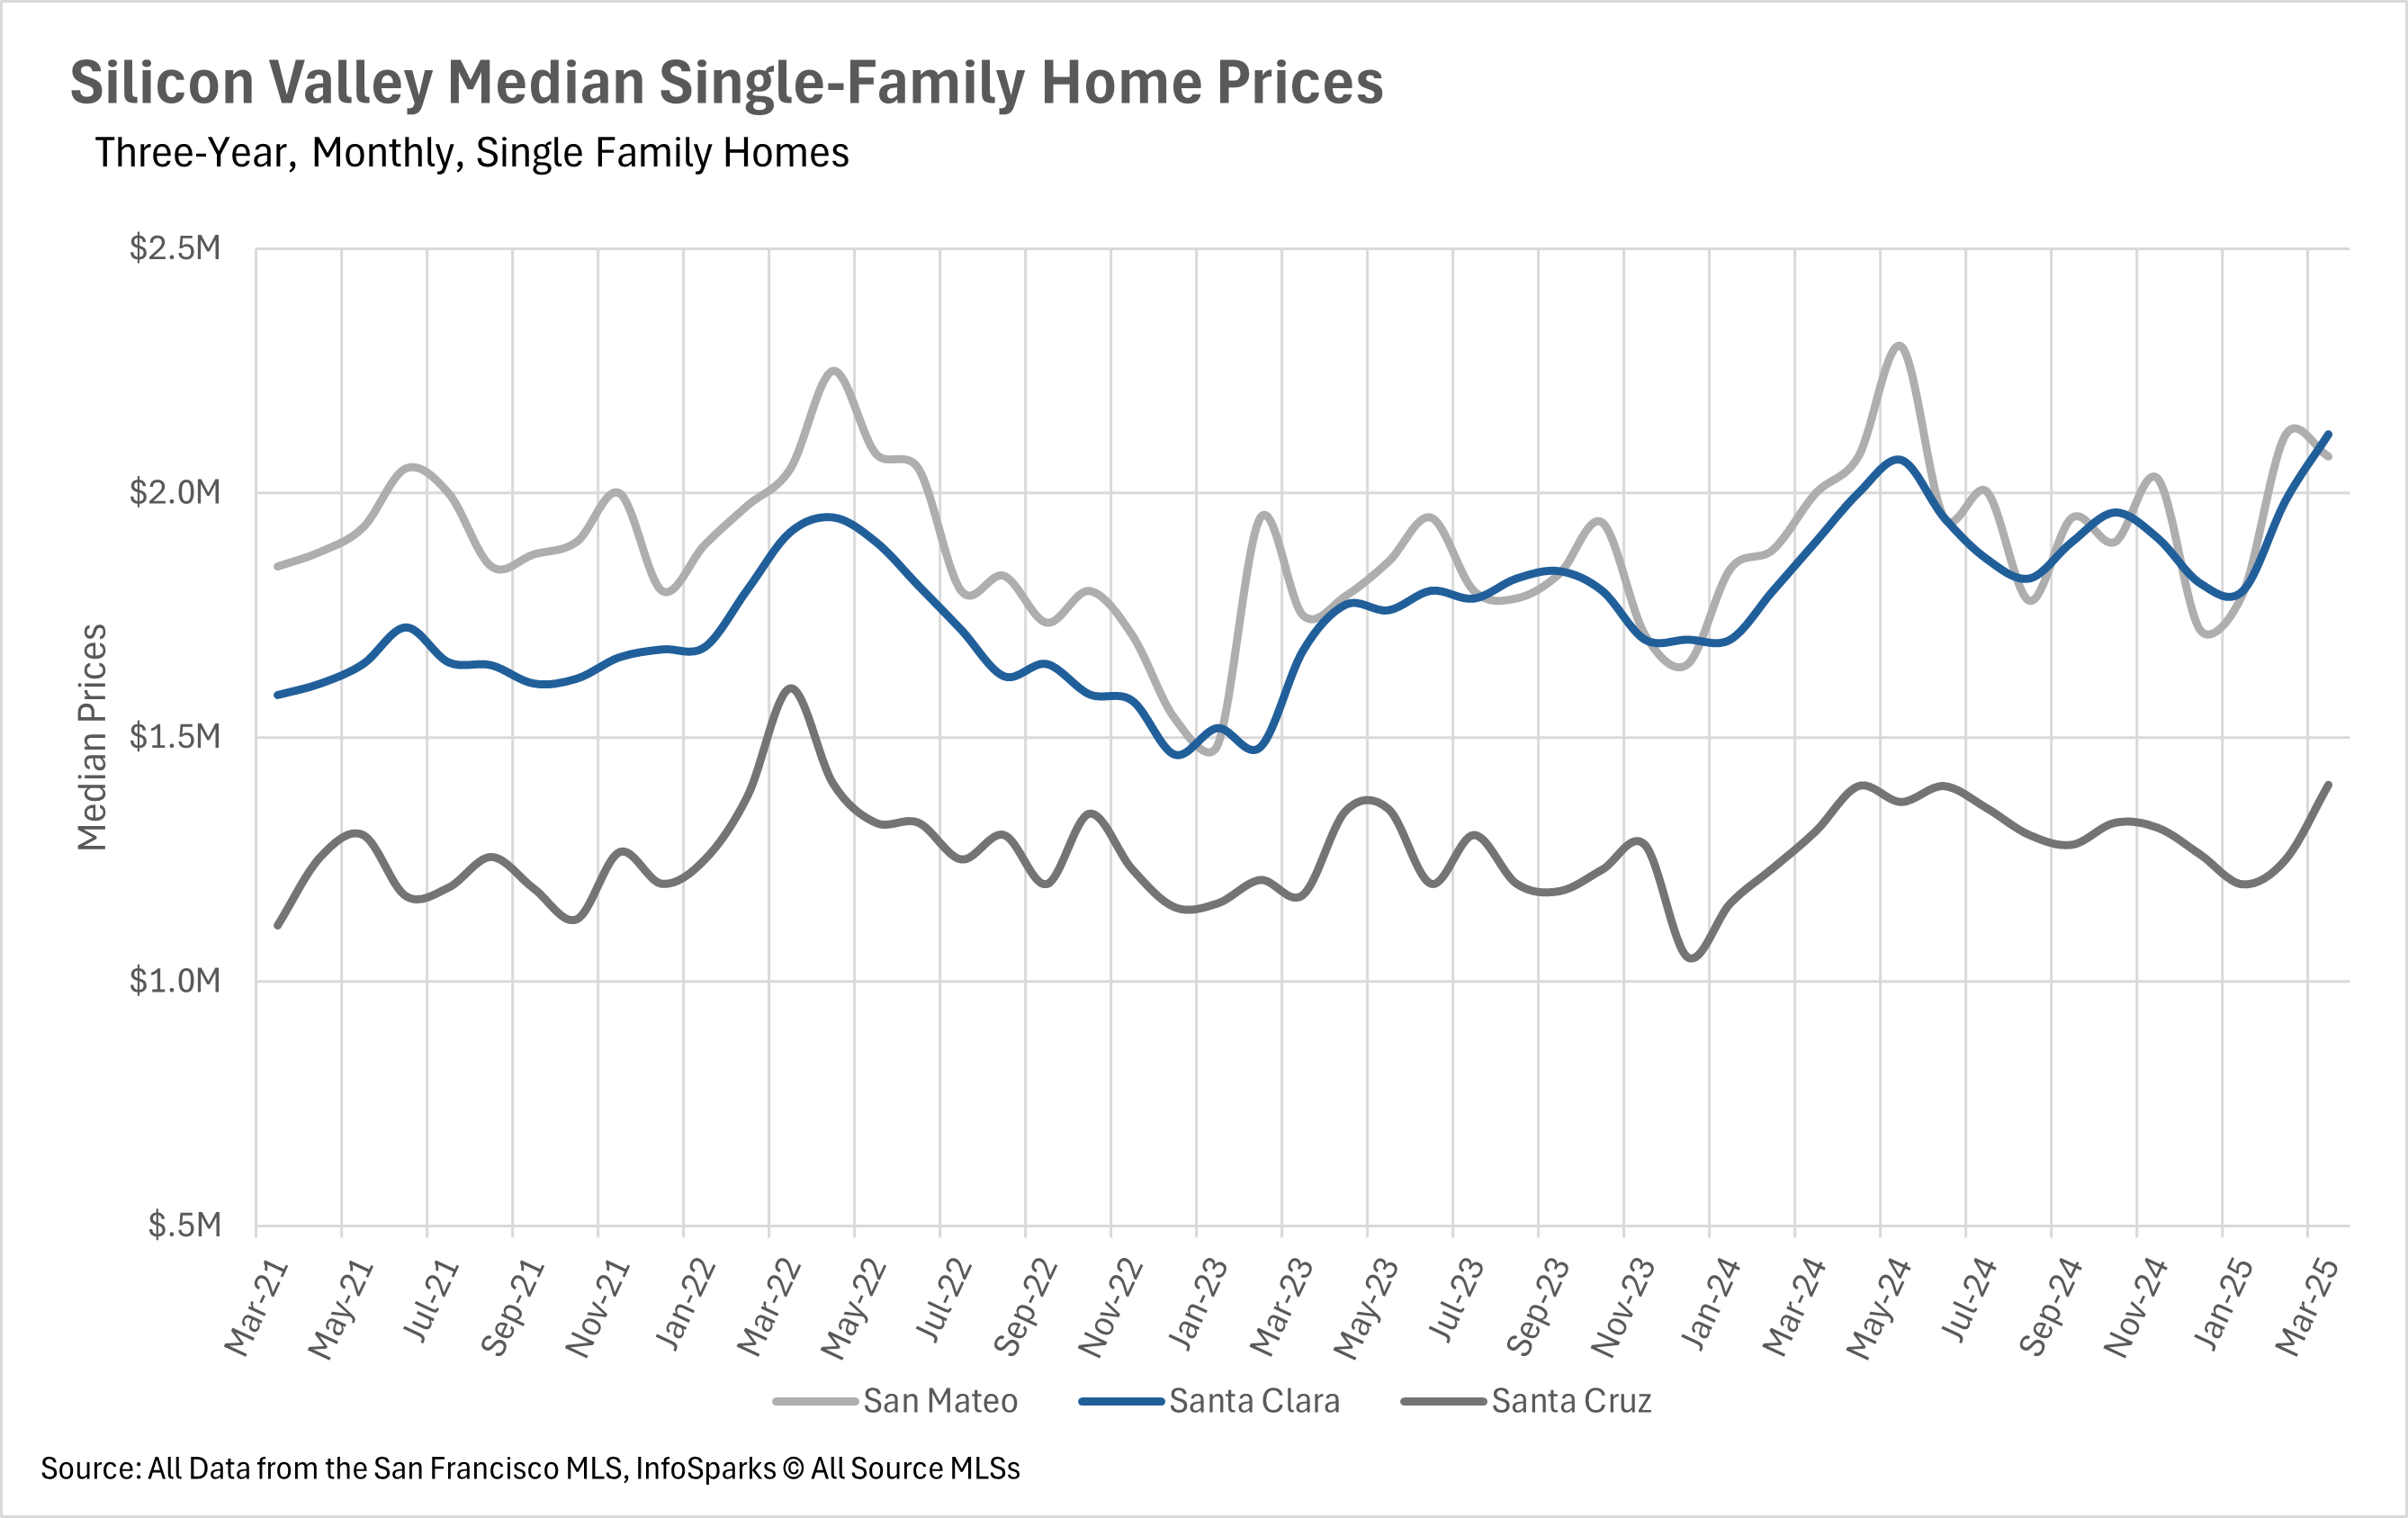
The Bay Area real estate market is showing varied performance across its different regions. Silicon Valley continues to be a hotspot for growth, with Santa Clara County experiencing an impressive 11.58% year-over-year increase in median sale price in March. San Mateo and Santa Cruz counties also saw healthy increases of 3.75% and 7.27%, respectively. In contrast, the East Bay market has cooled somewhat, with year-over-year median sale prices dropping by 4.41% in Alameda County and 7.44% in Contra Costa County, though month-over-month trends remain positive. San Francisco presents a tale of two markets, with single-family homes maintaining their value (increasing 6.63% over four years) while condo values have declined by 12.52% over the same period, highlighting buyer preference for detached homes over shared buildings.
 

Inventory levels and new listings show regional variations

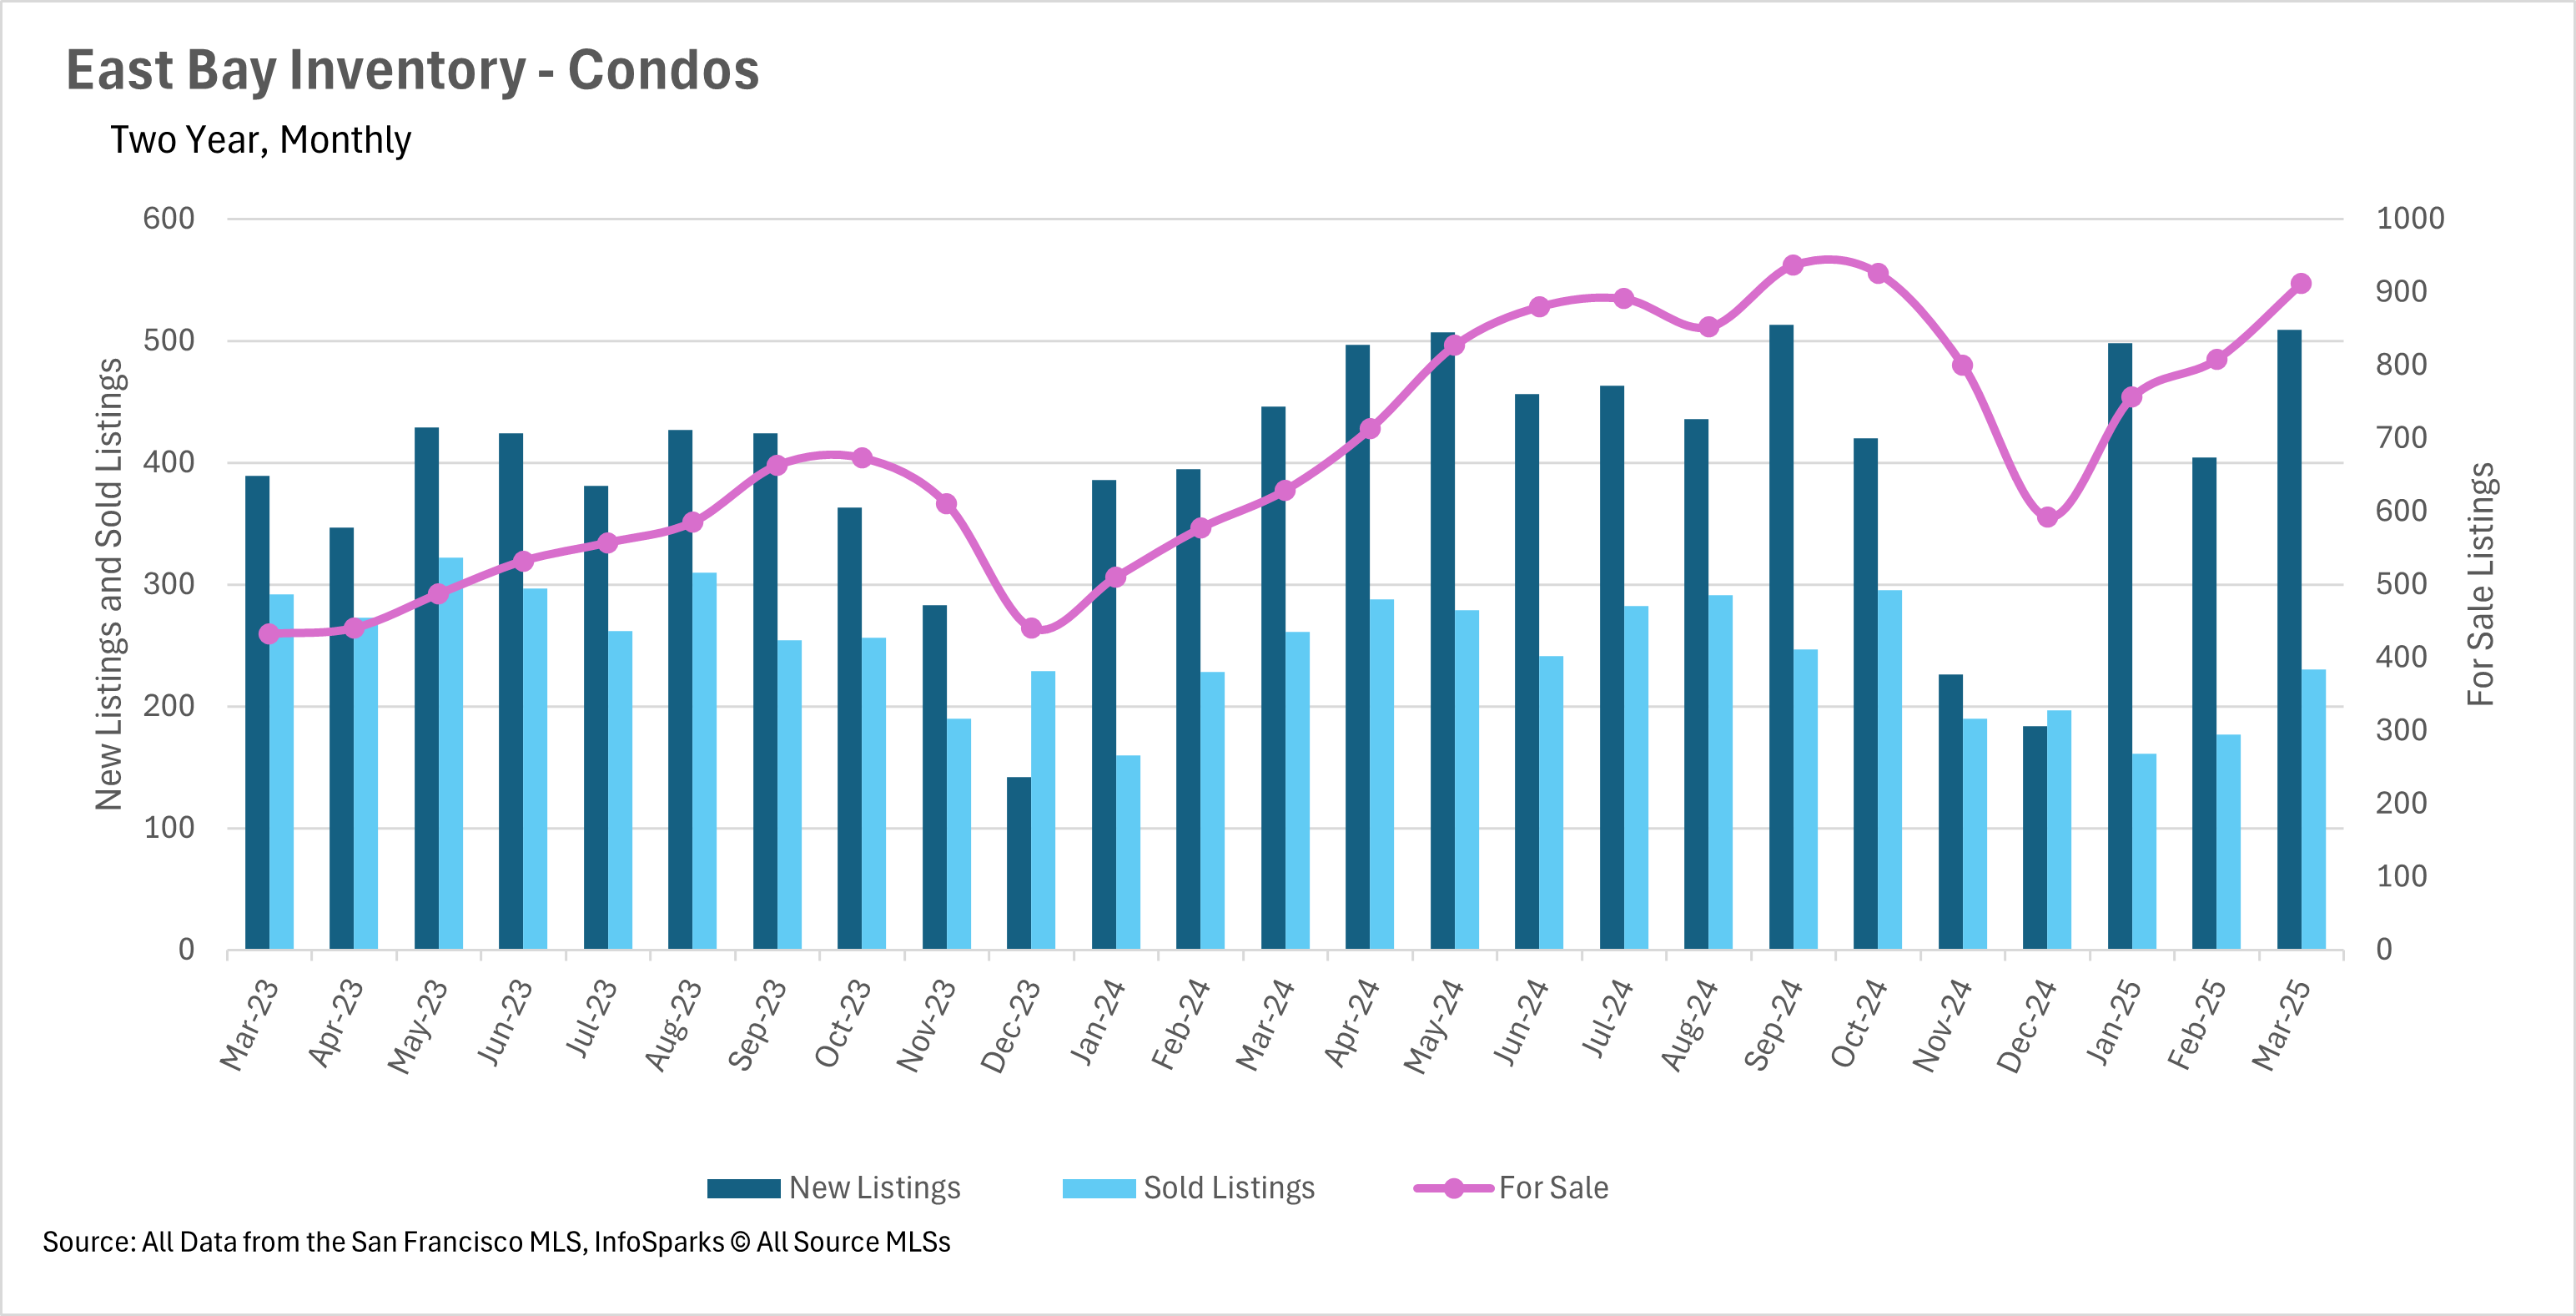
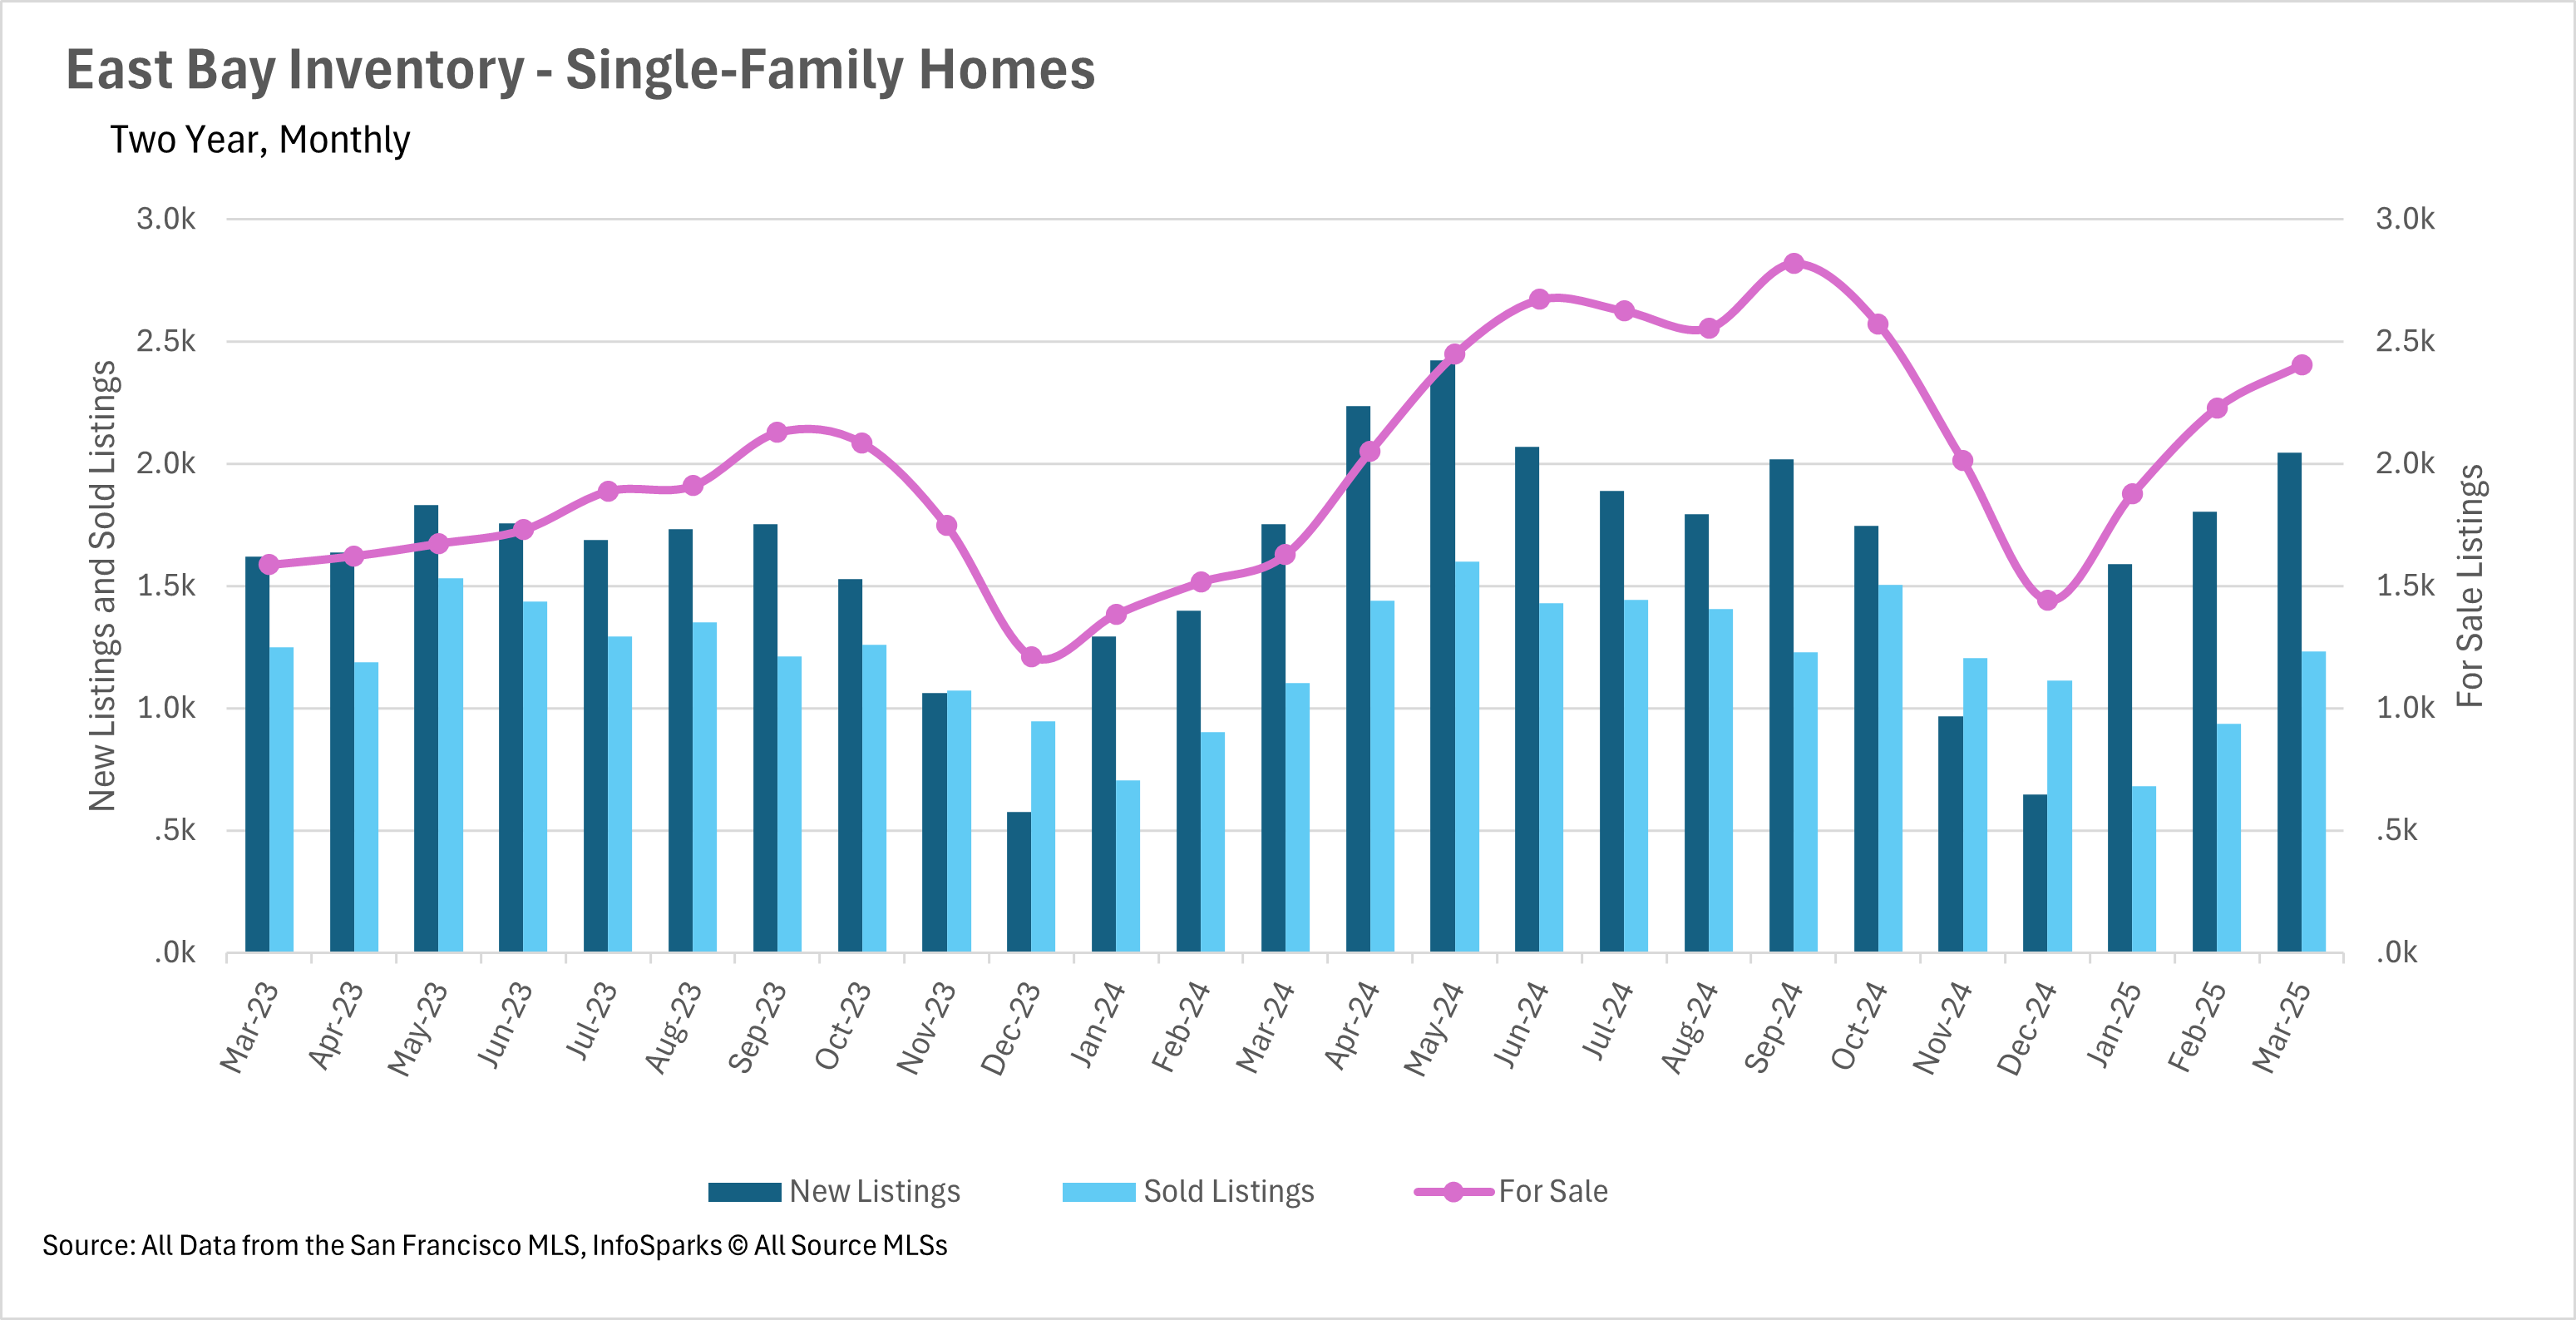
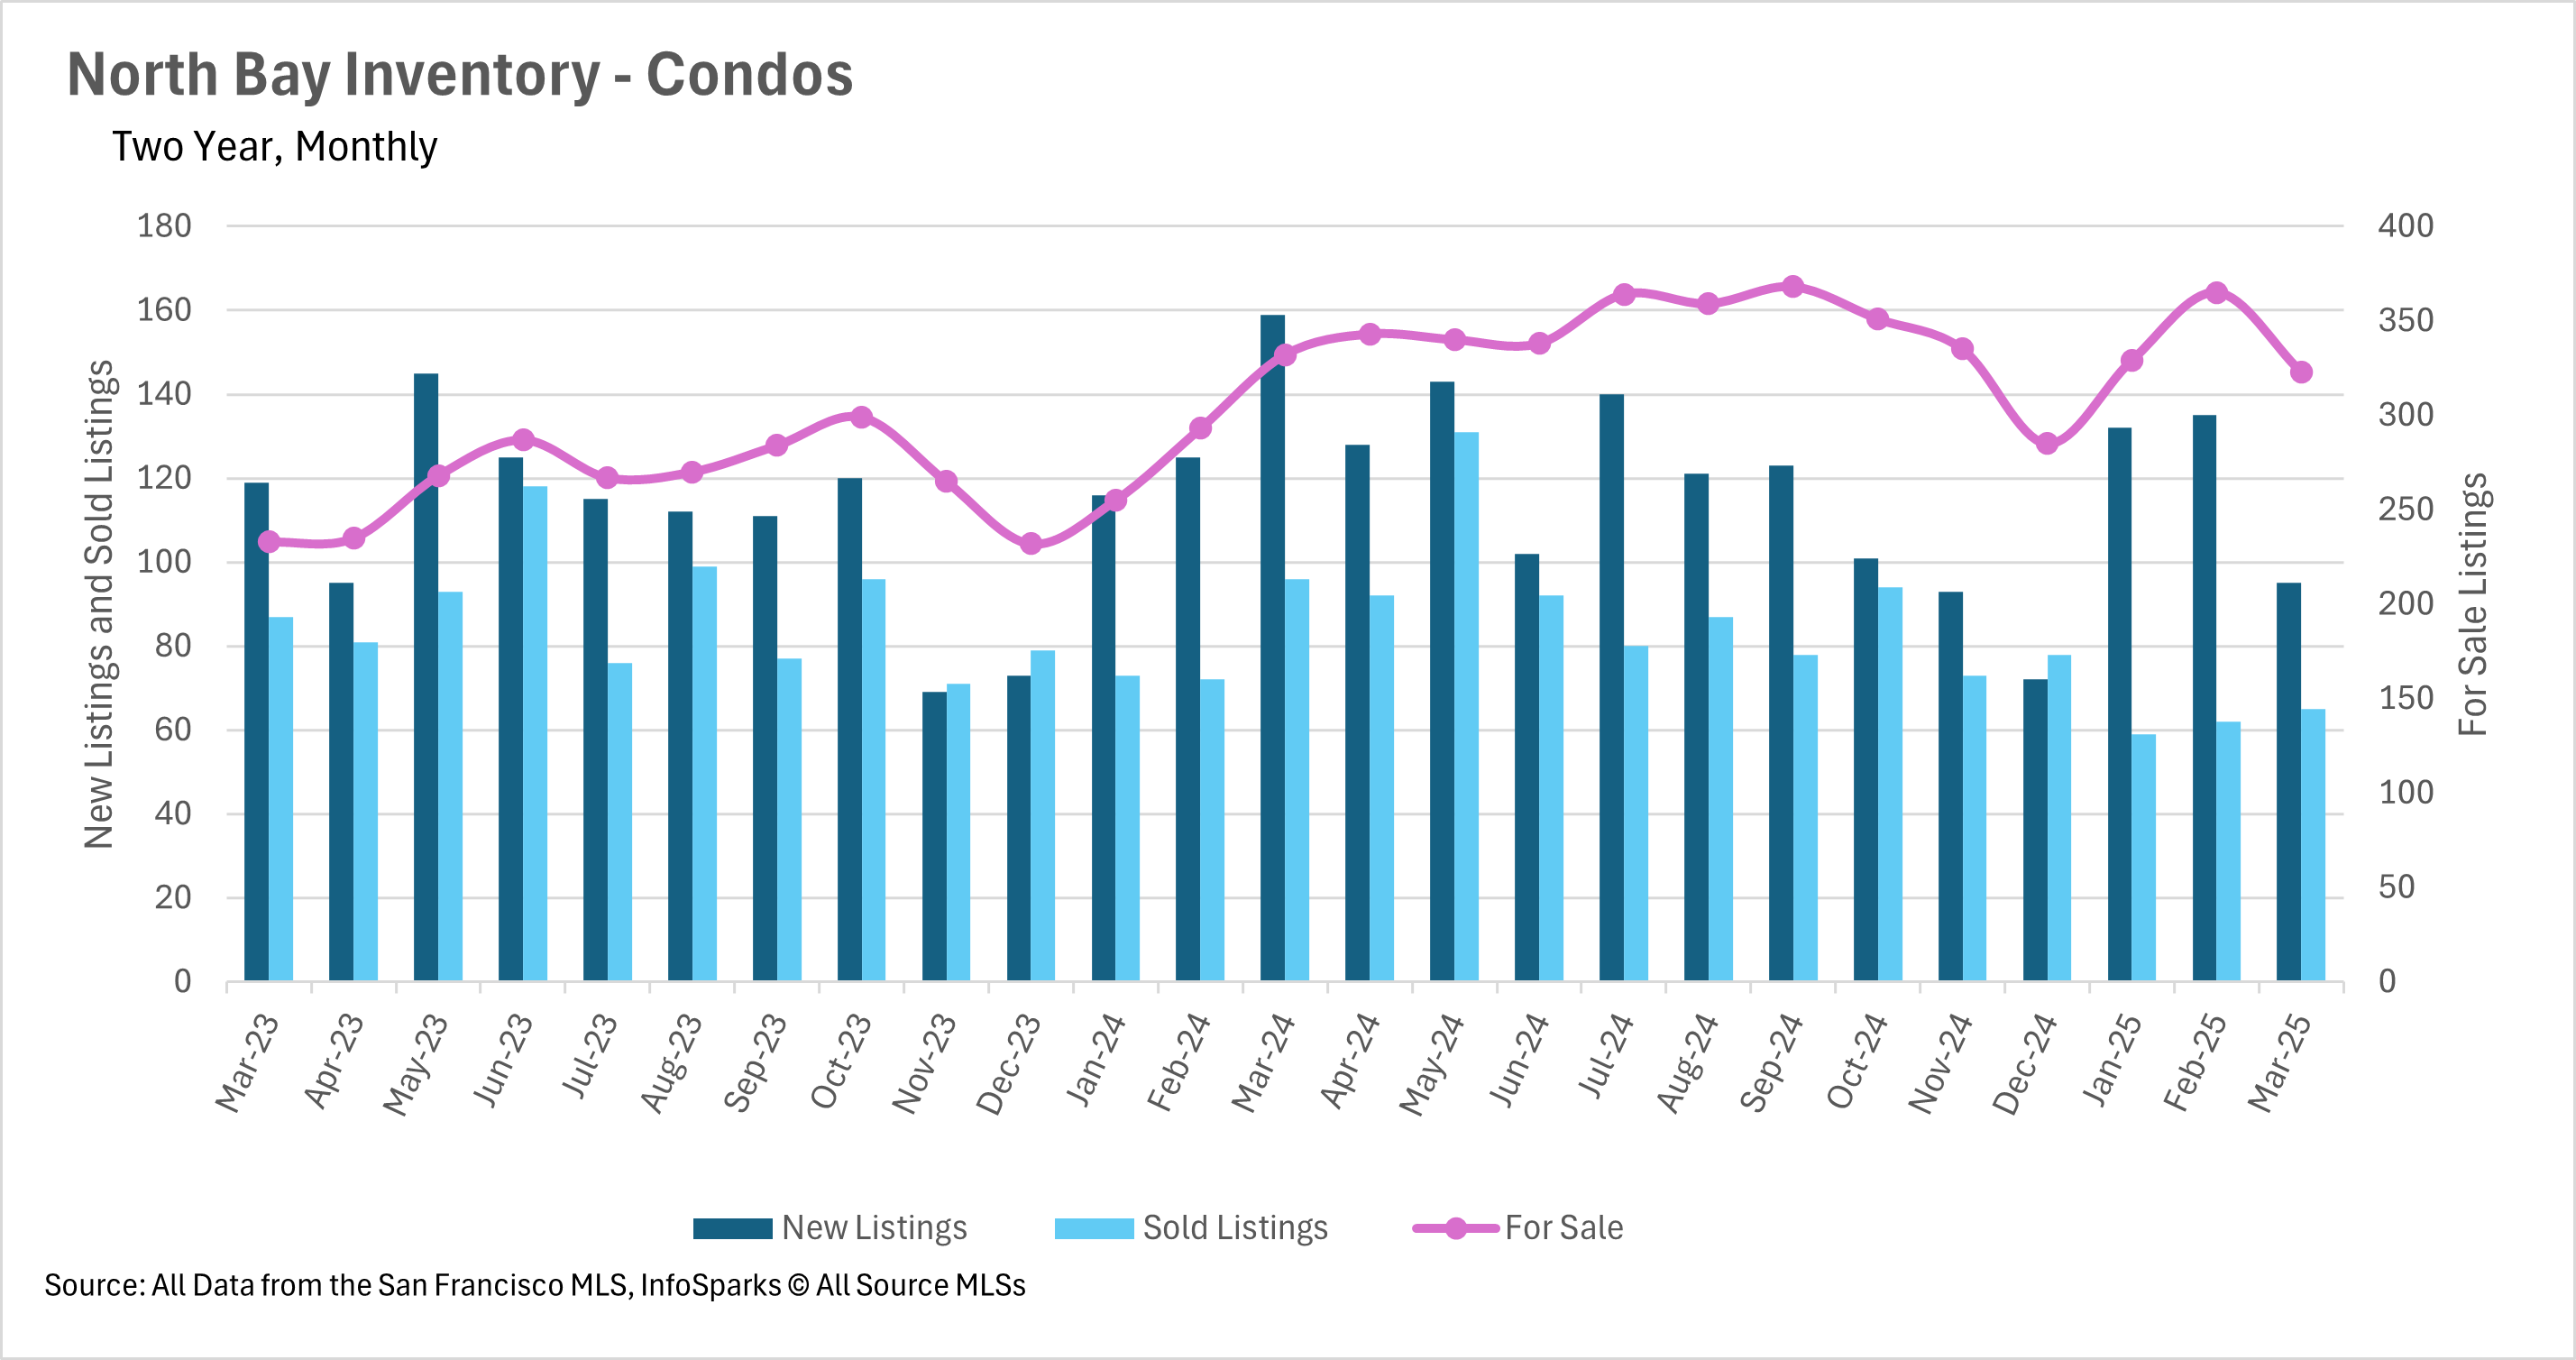
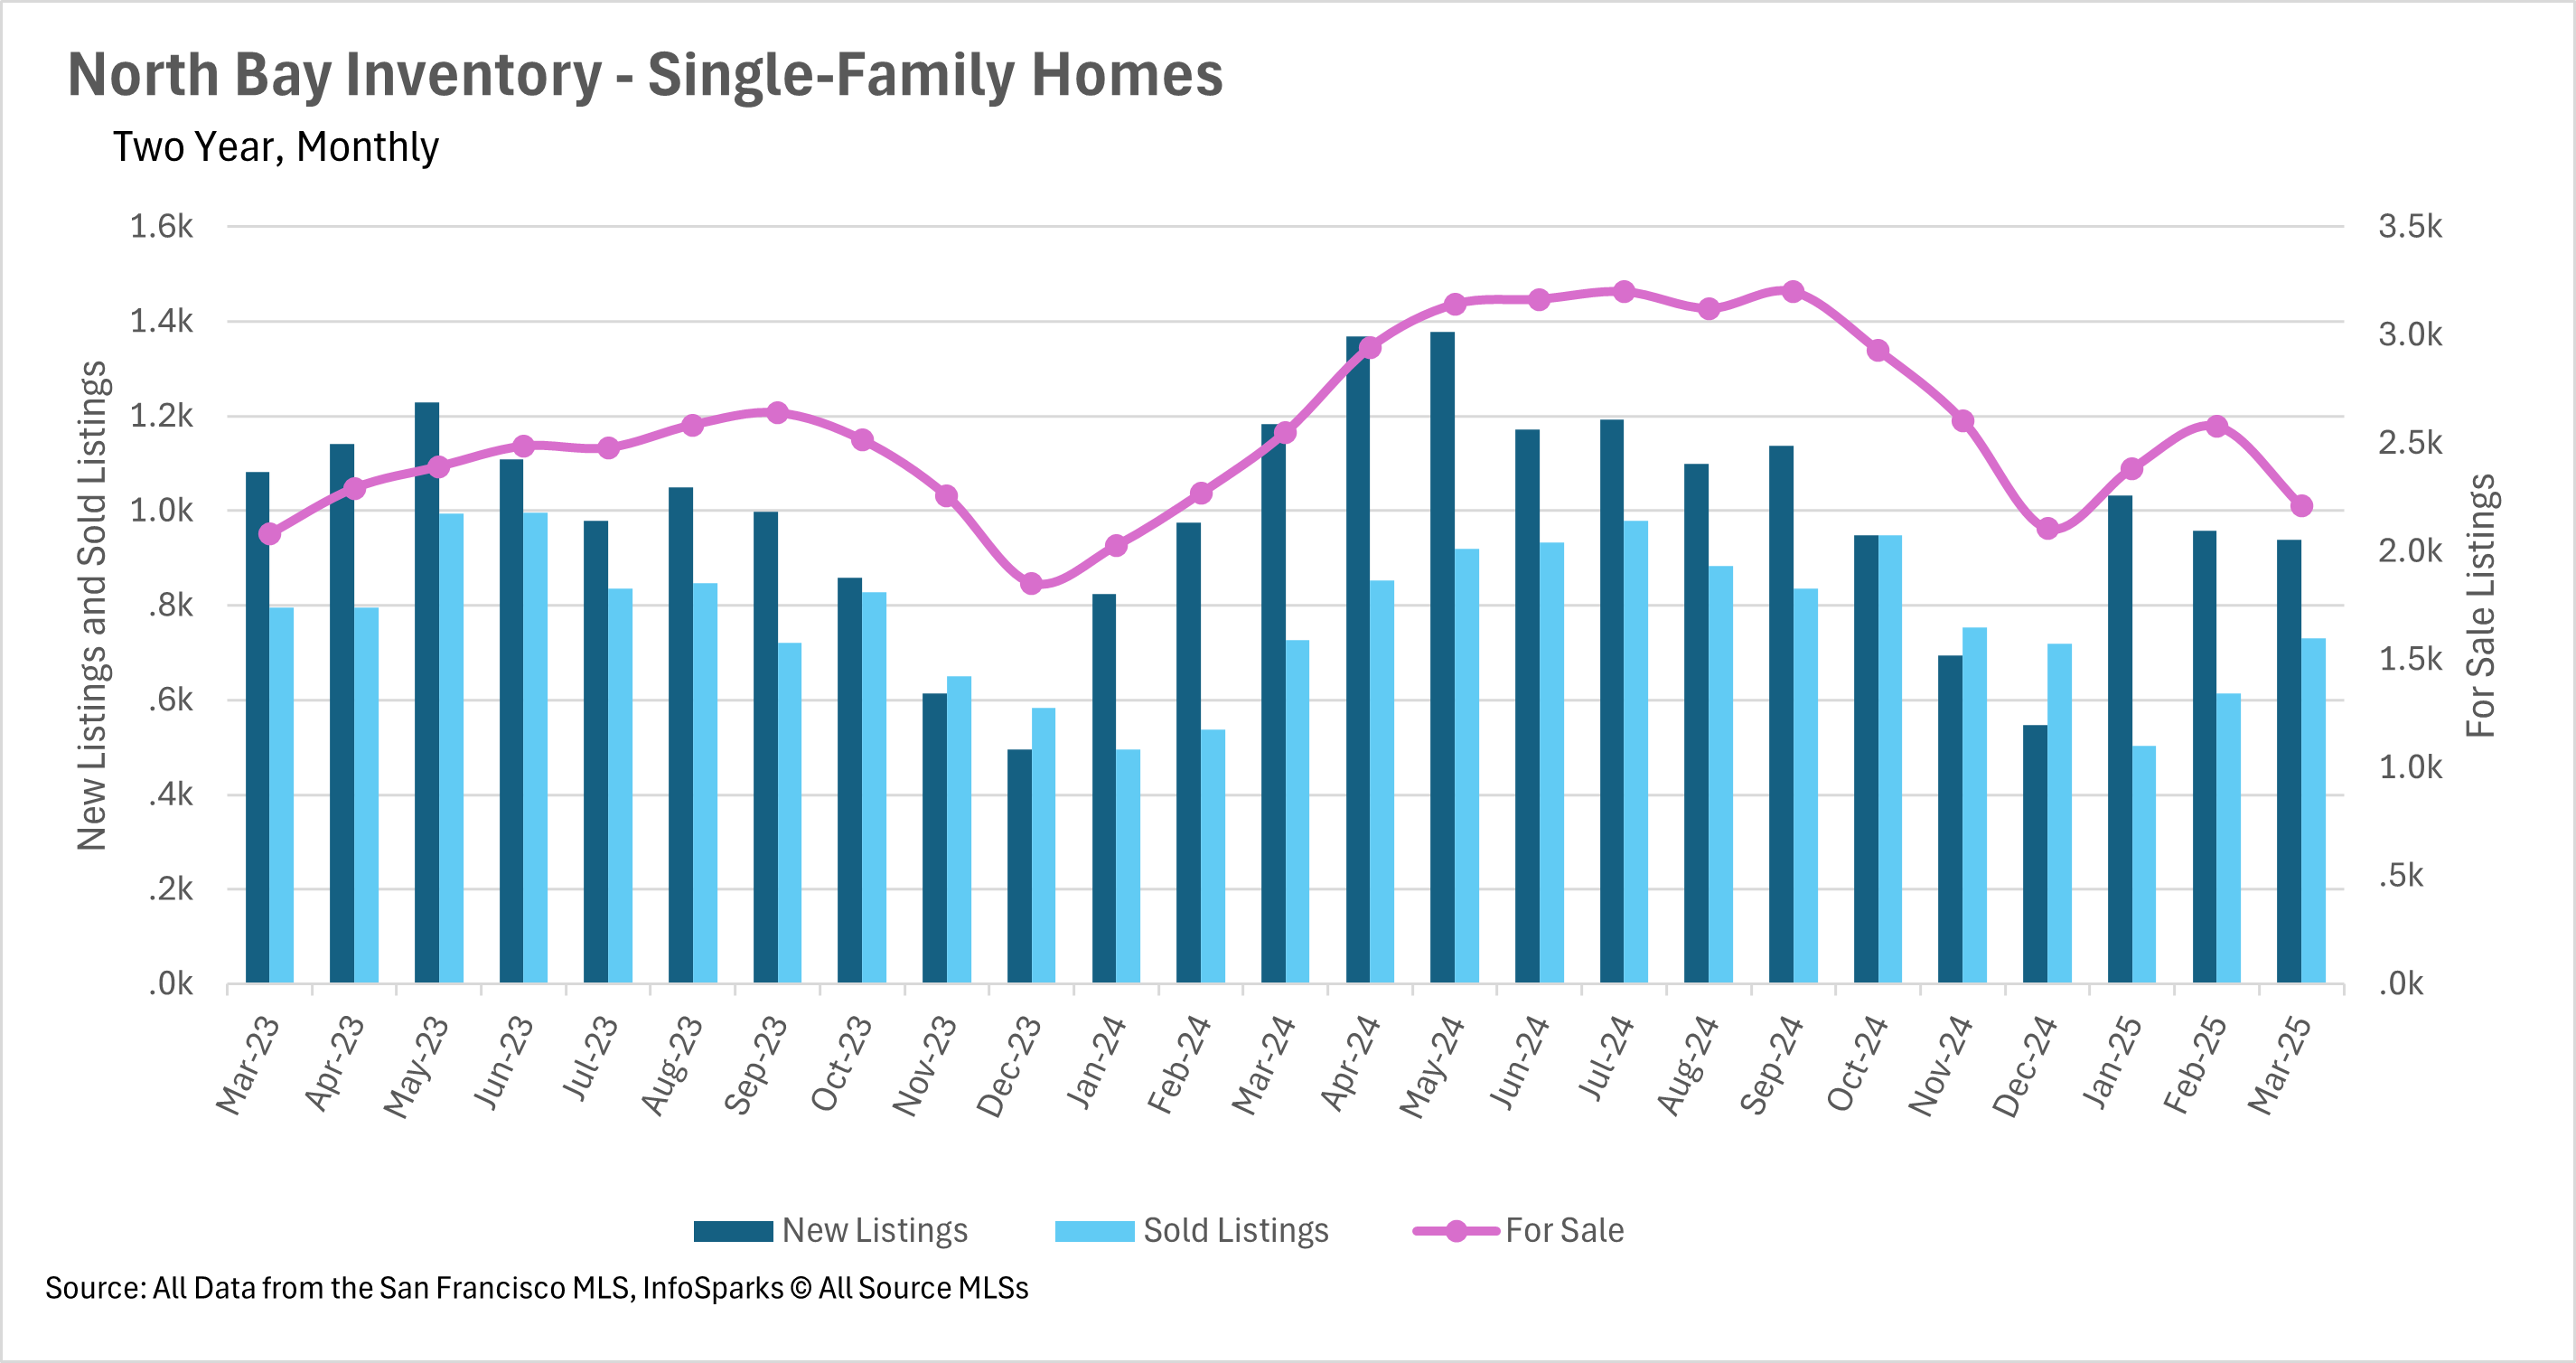
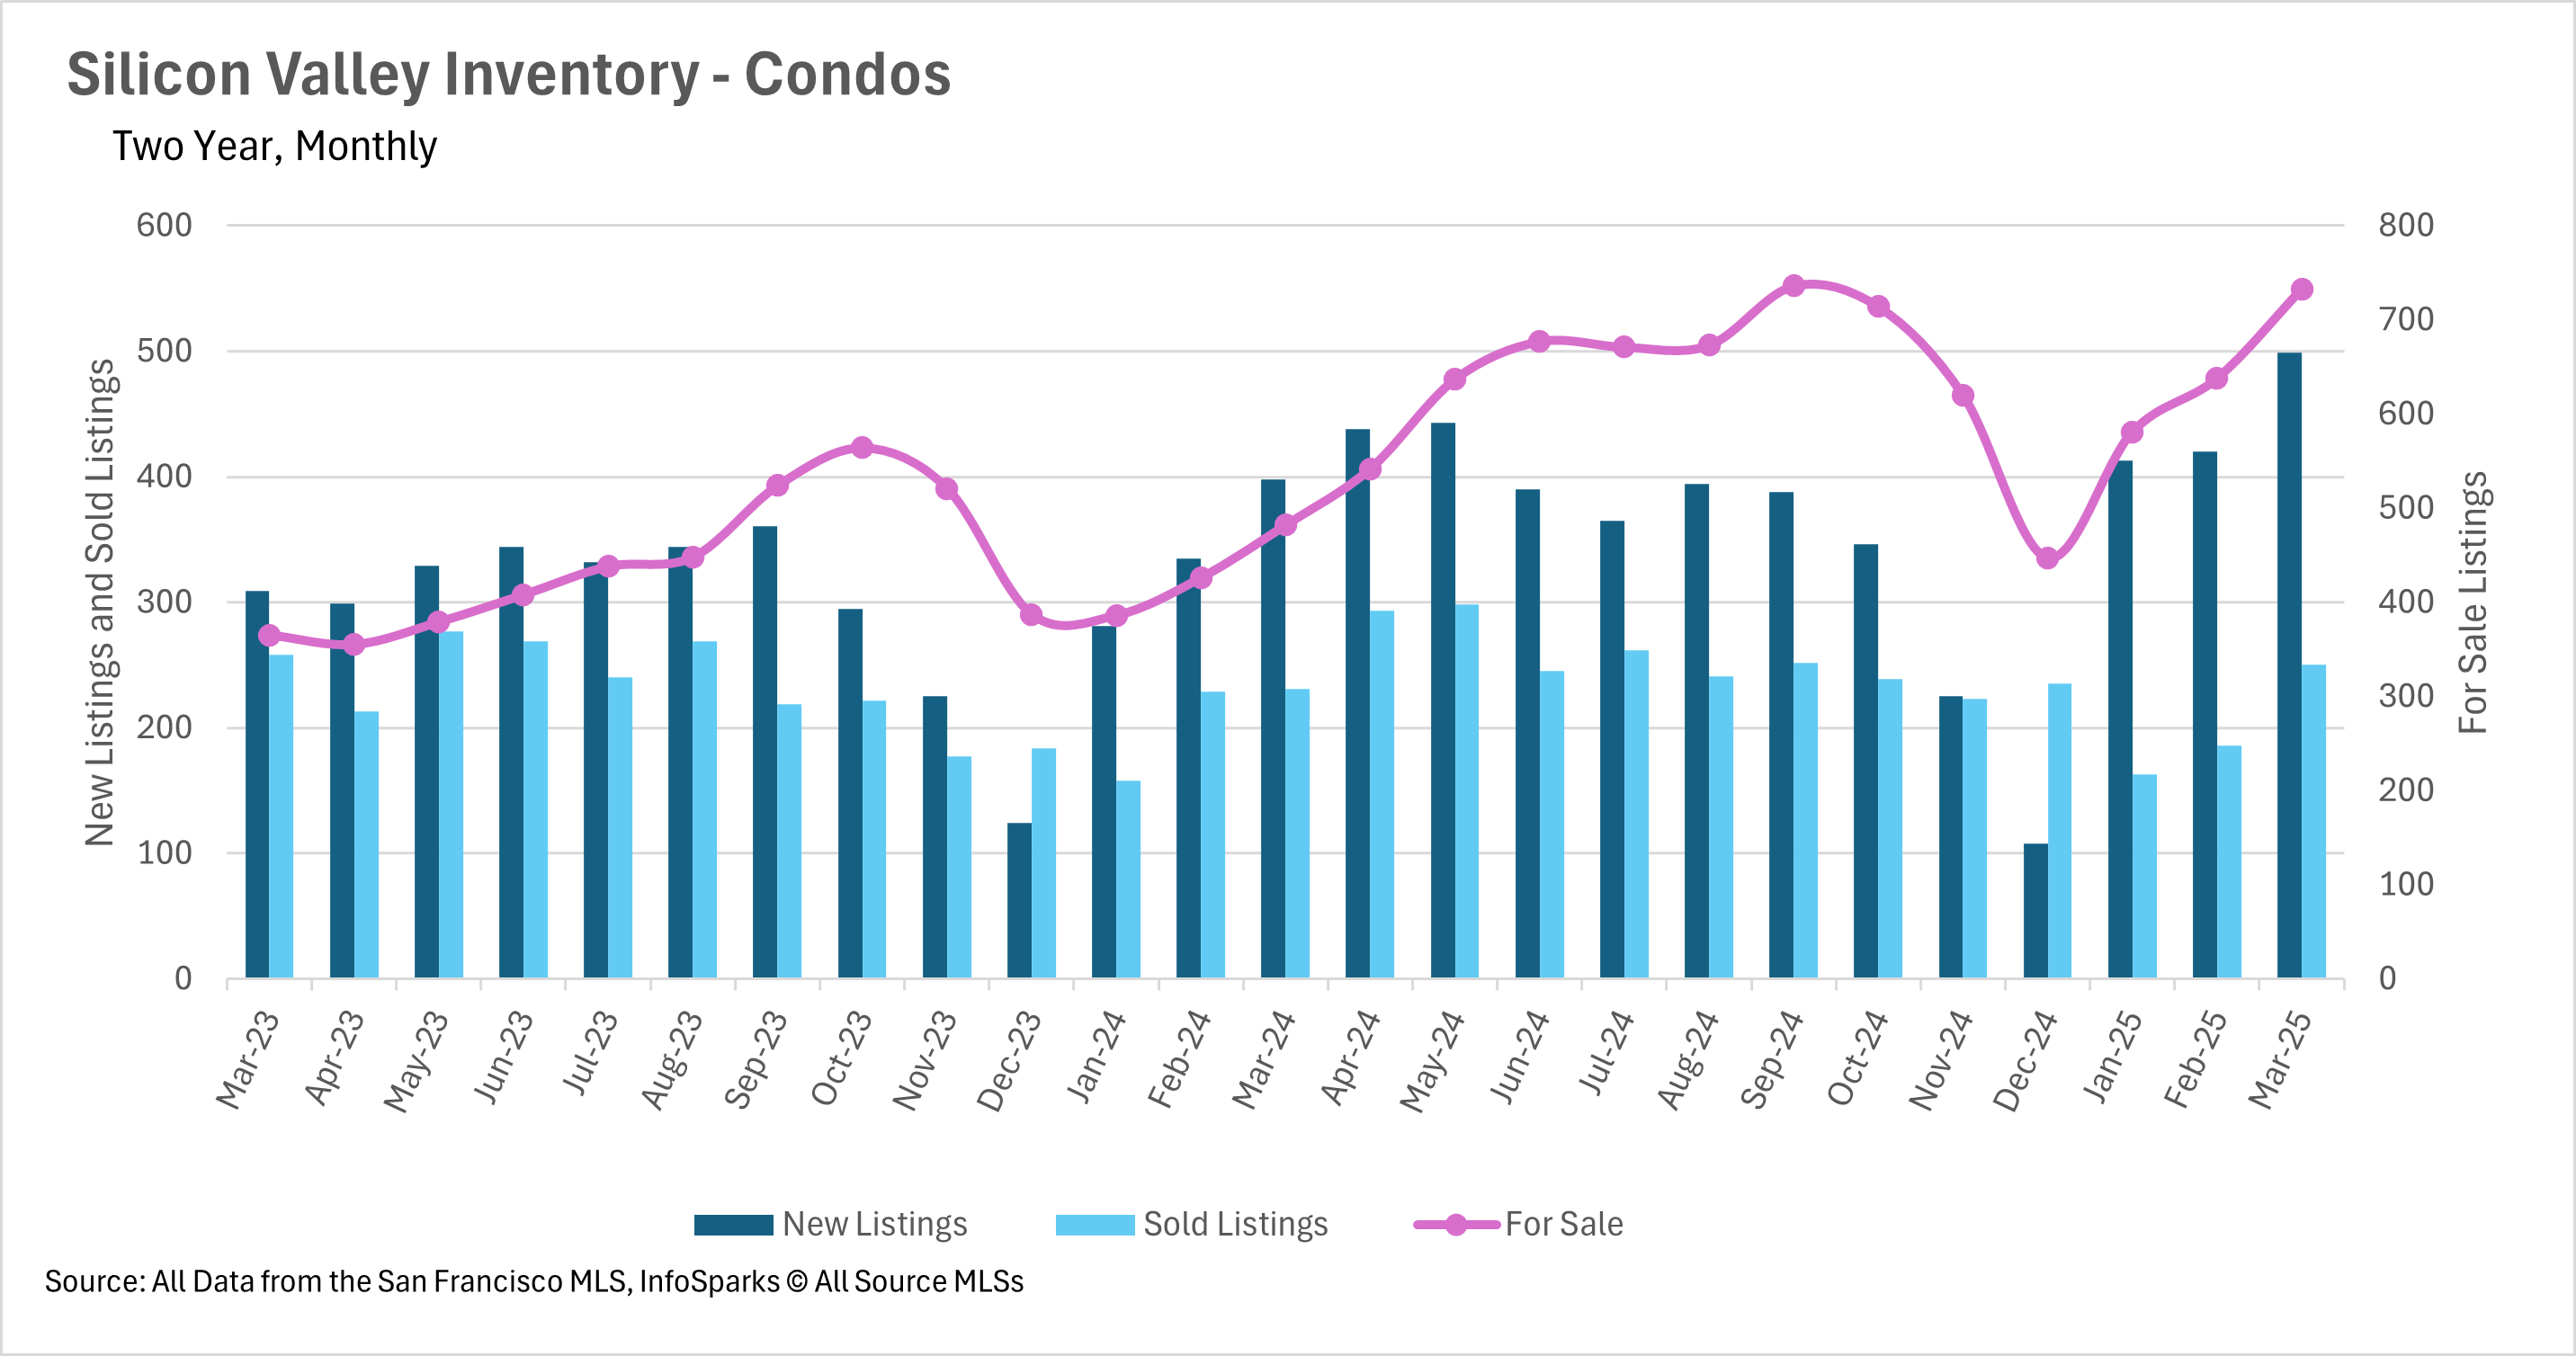
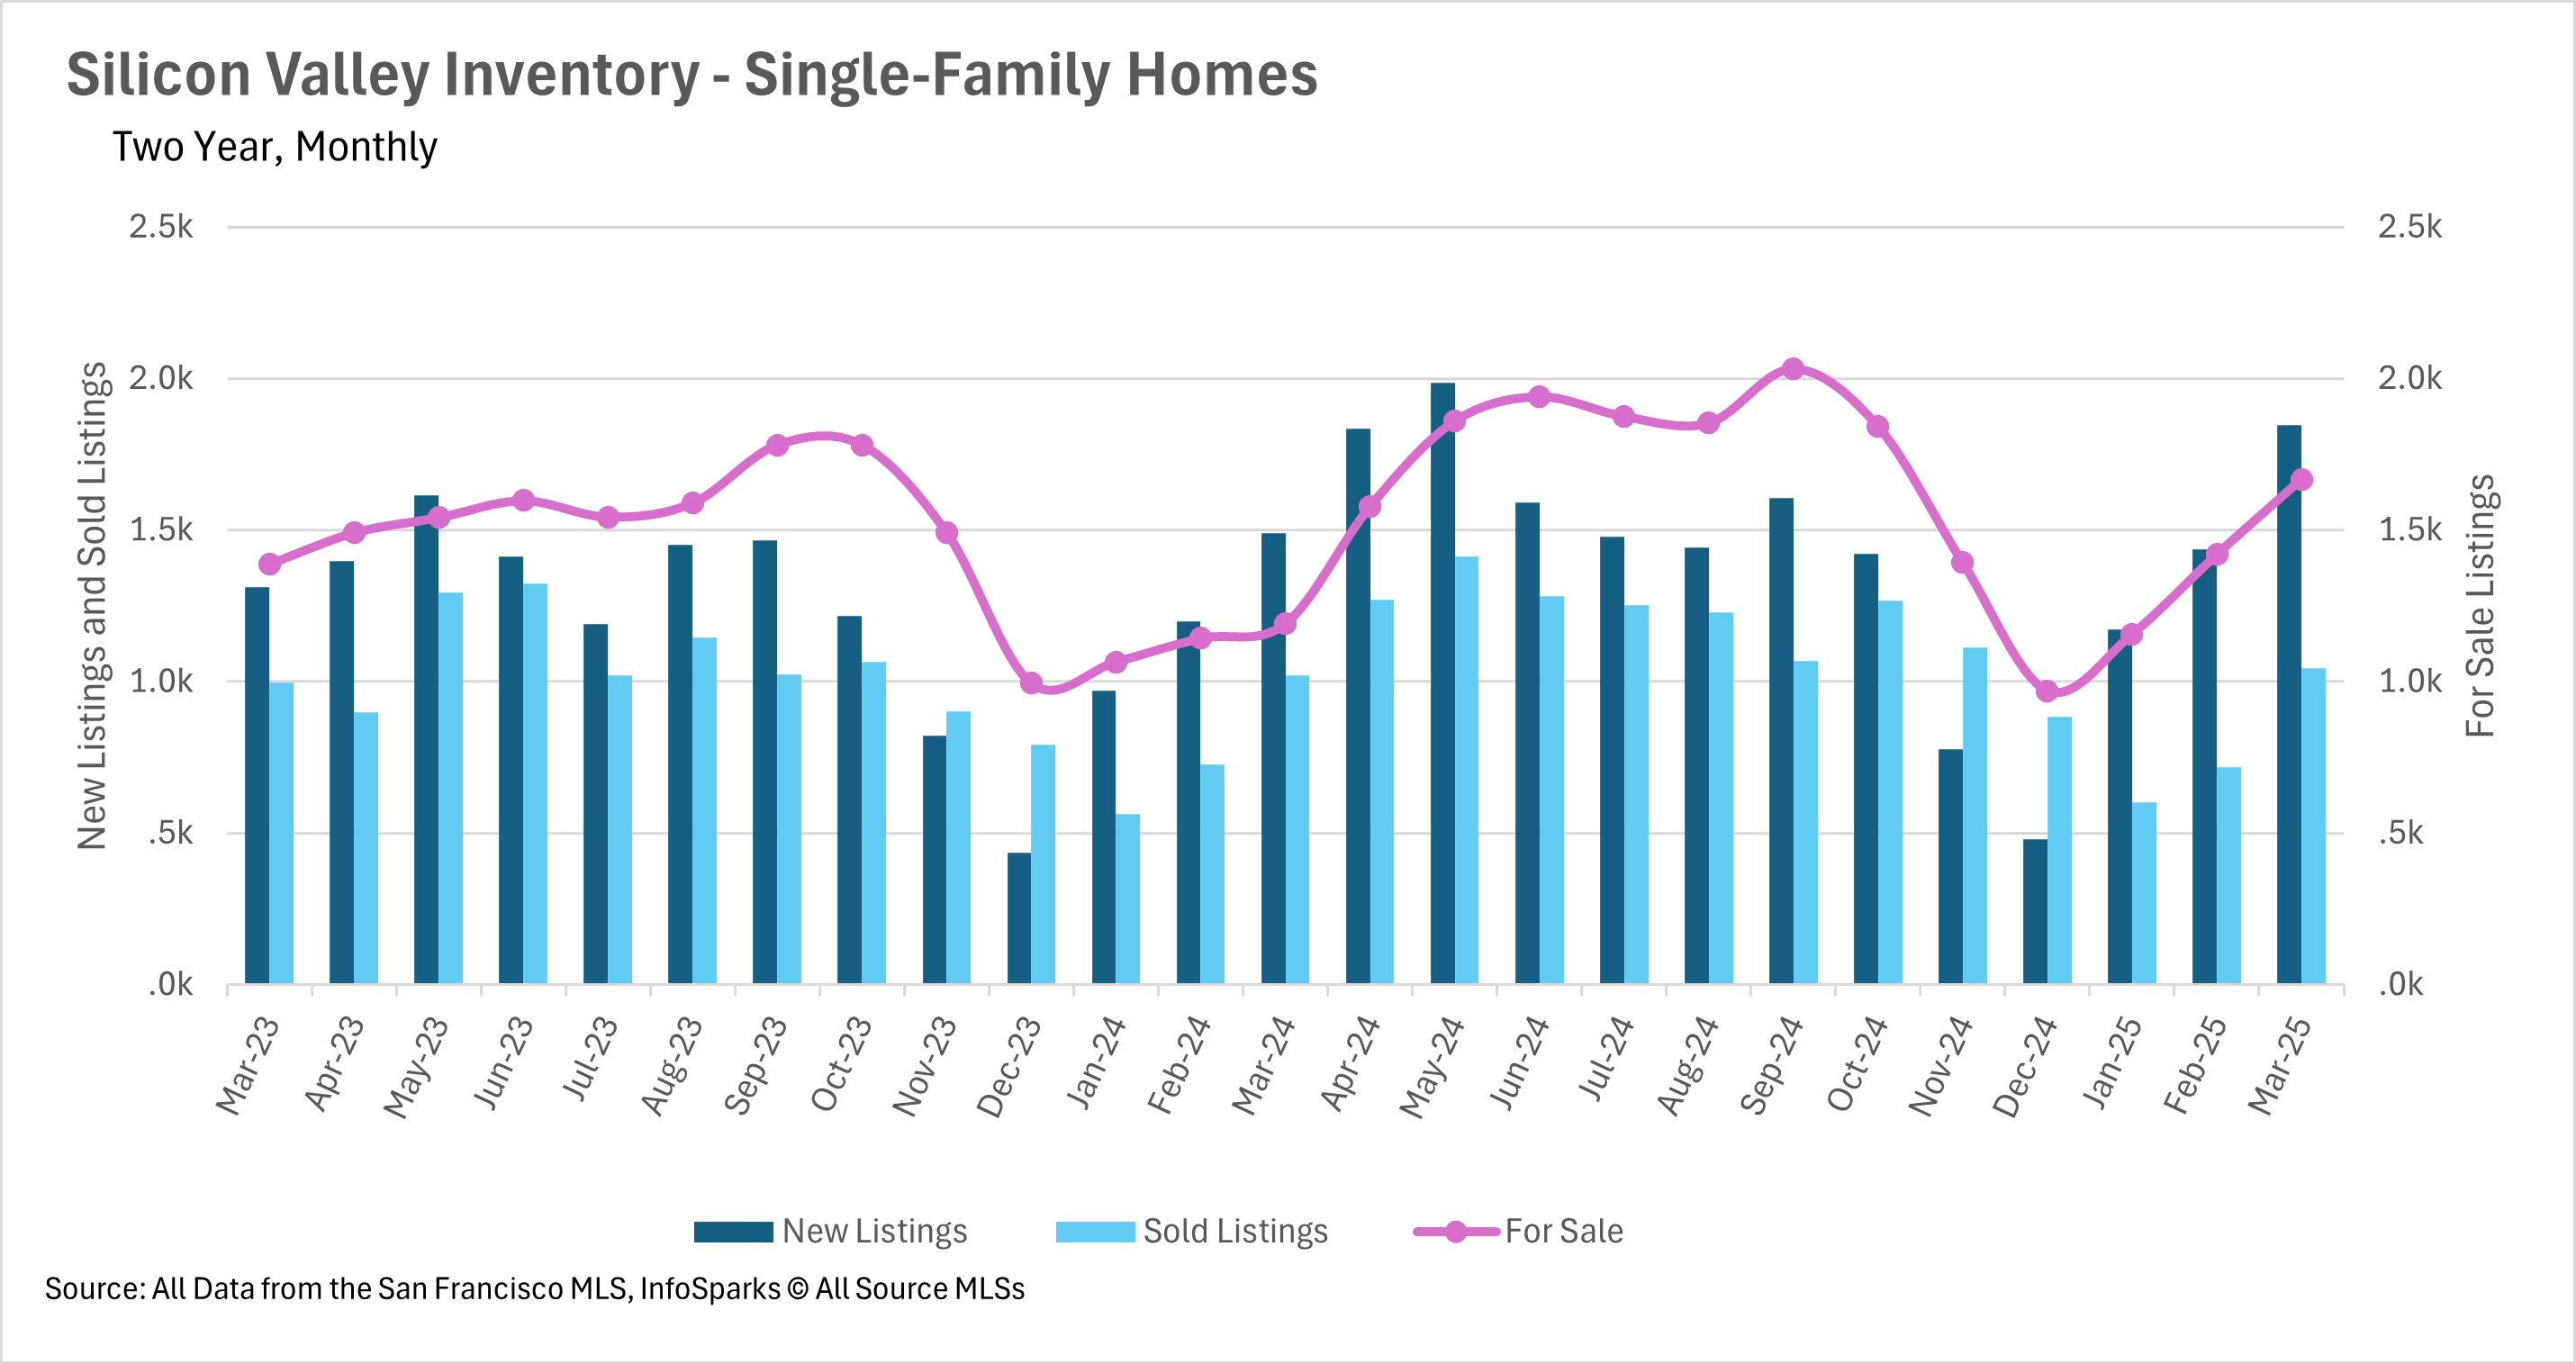
Inventory trends across the Bay Area show significant regional differences. Silicon Valley is experiencing substantial inventory growth, with single-family home inventories increasing by 40.05% in March, boosted by a 23.83% jump in new listings compared to last year. Similarly, the East Bay saw active listings increase by 47.79% year-over-year, with new listings in March up 16.78%. In stark contrast, San Francisco continues to struggle with inventory shortages, particularly for single-family homes, with just 1.5 months of supply available. The North Bay region is also facing inventory challenges, with a 14.28% month-over-month decrease in March and 20.78% fewer new listings compared to March 2024. These divergent inventory trends are creating different market dynamics across the Bay Area regions.
 

Days on market vary dramatically by region

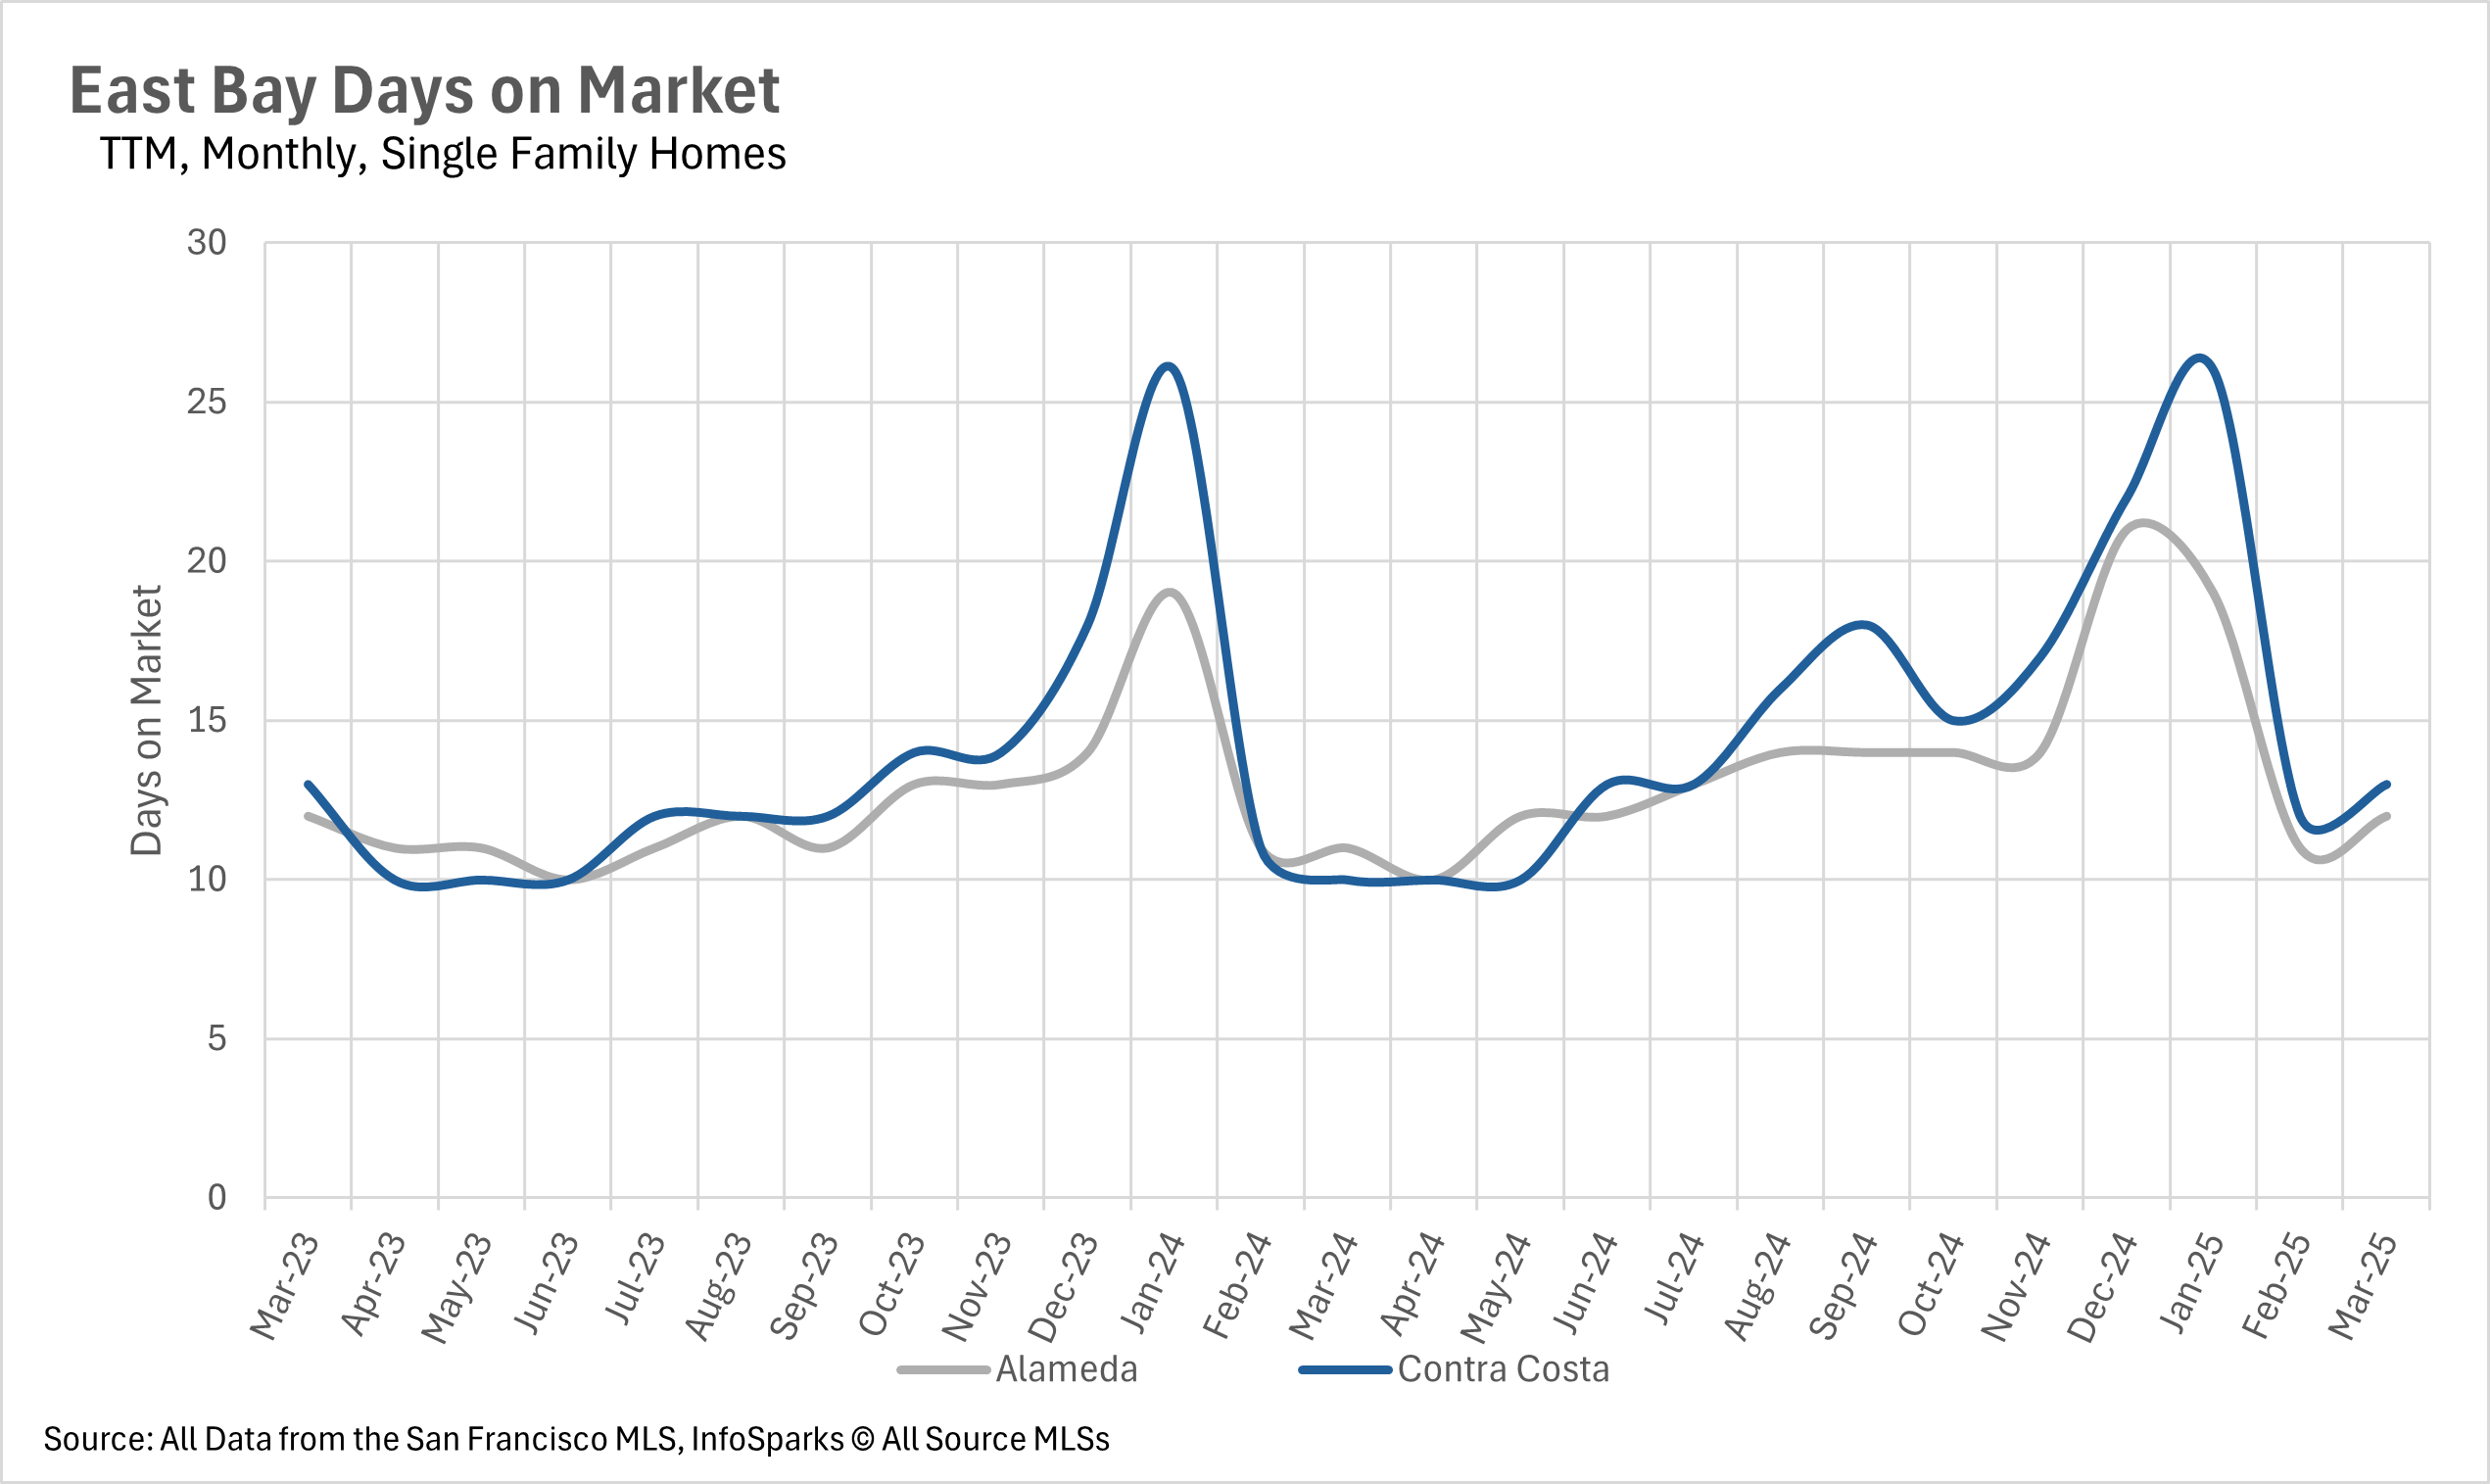
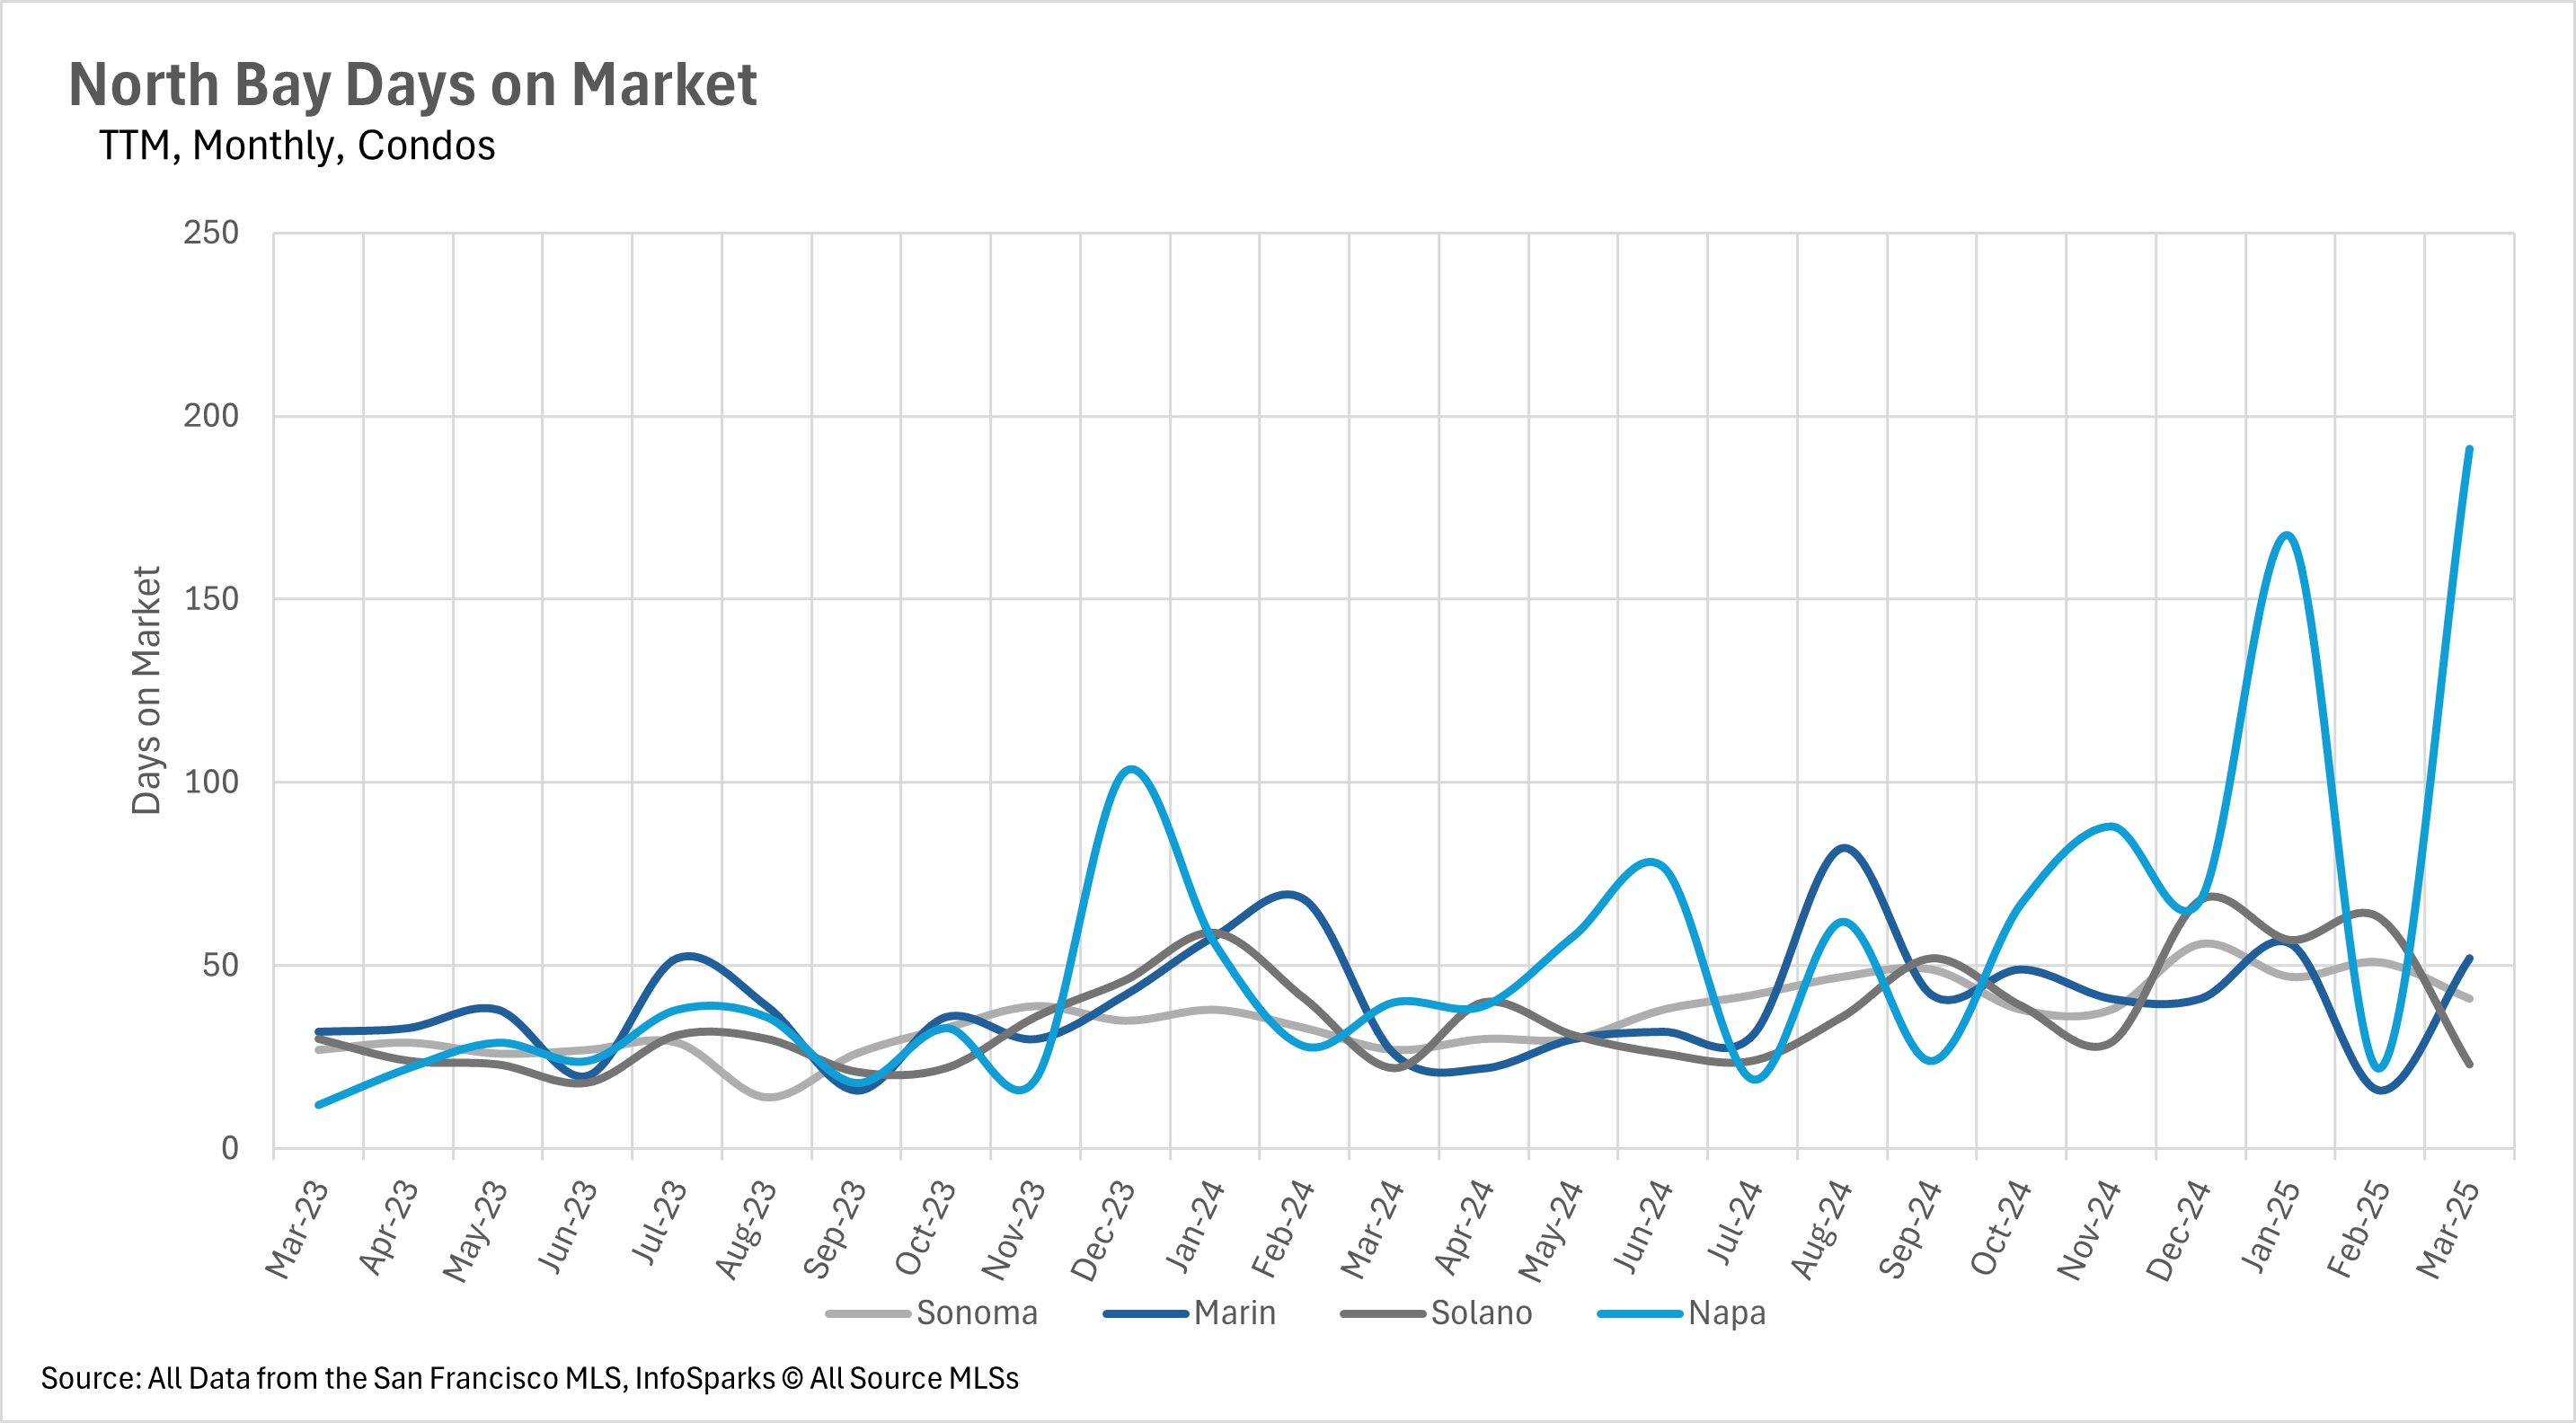
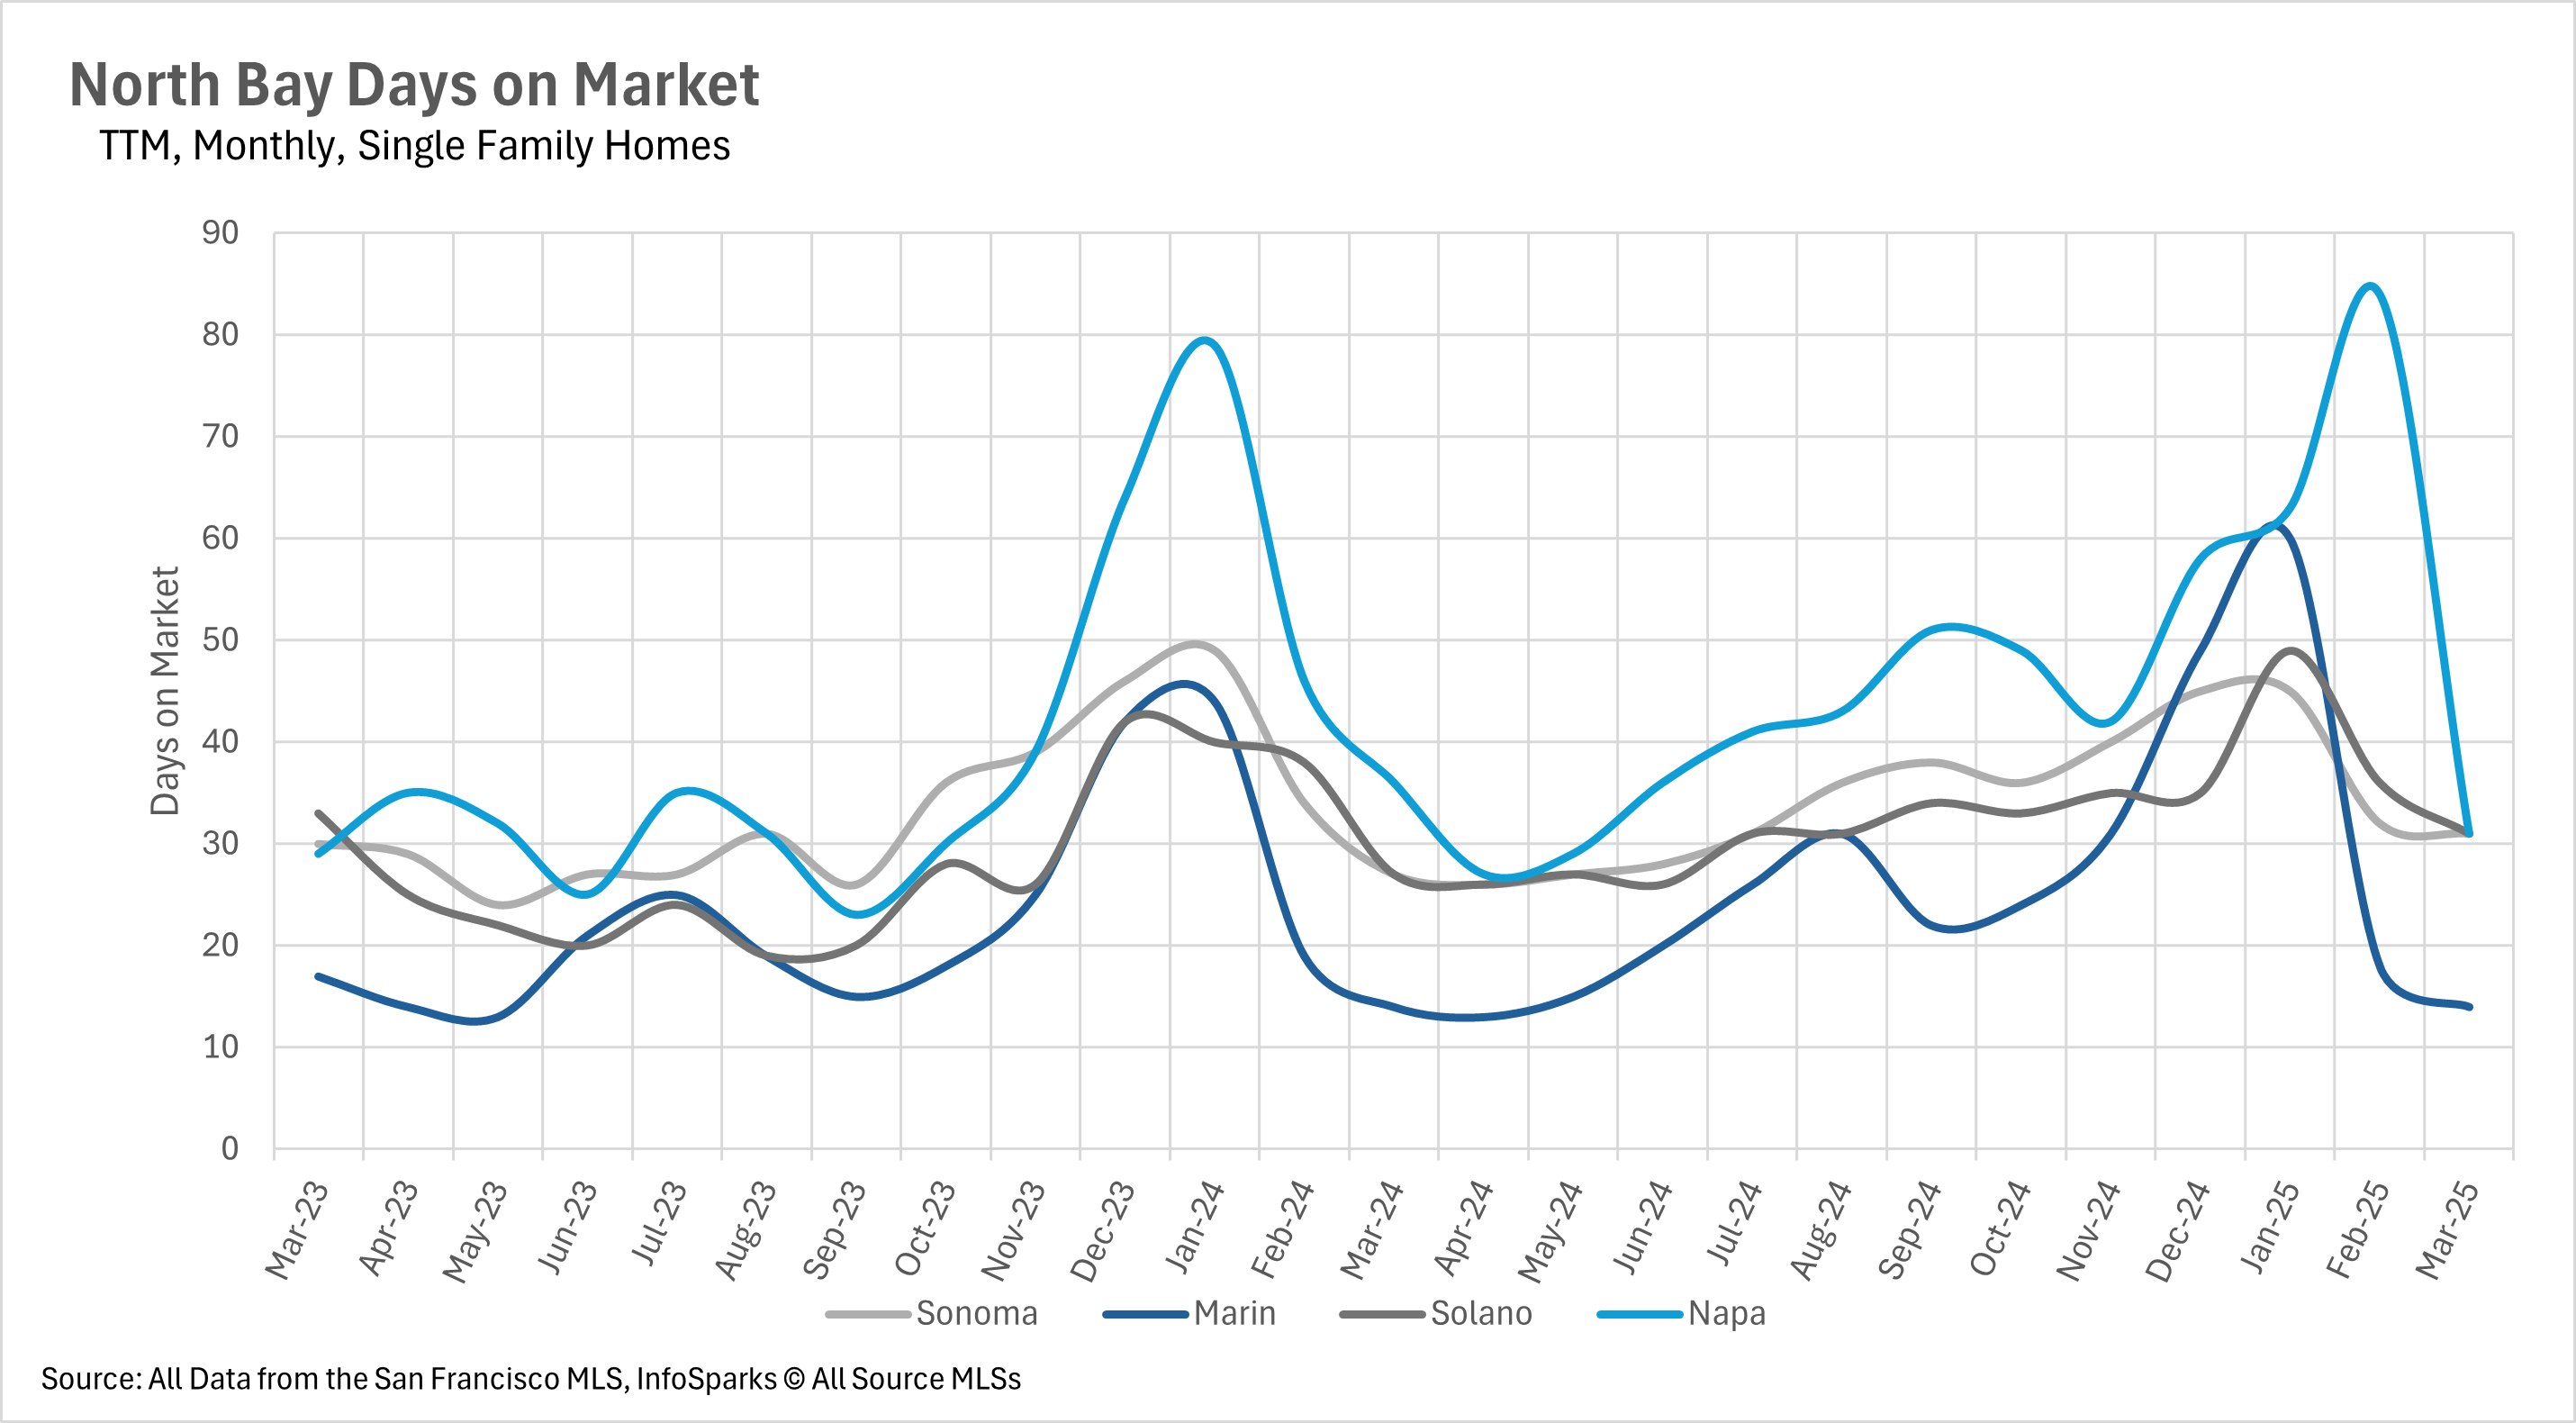
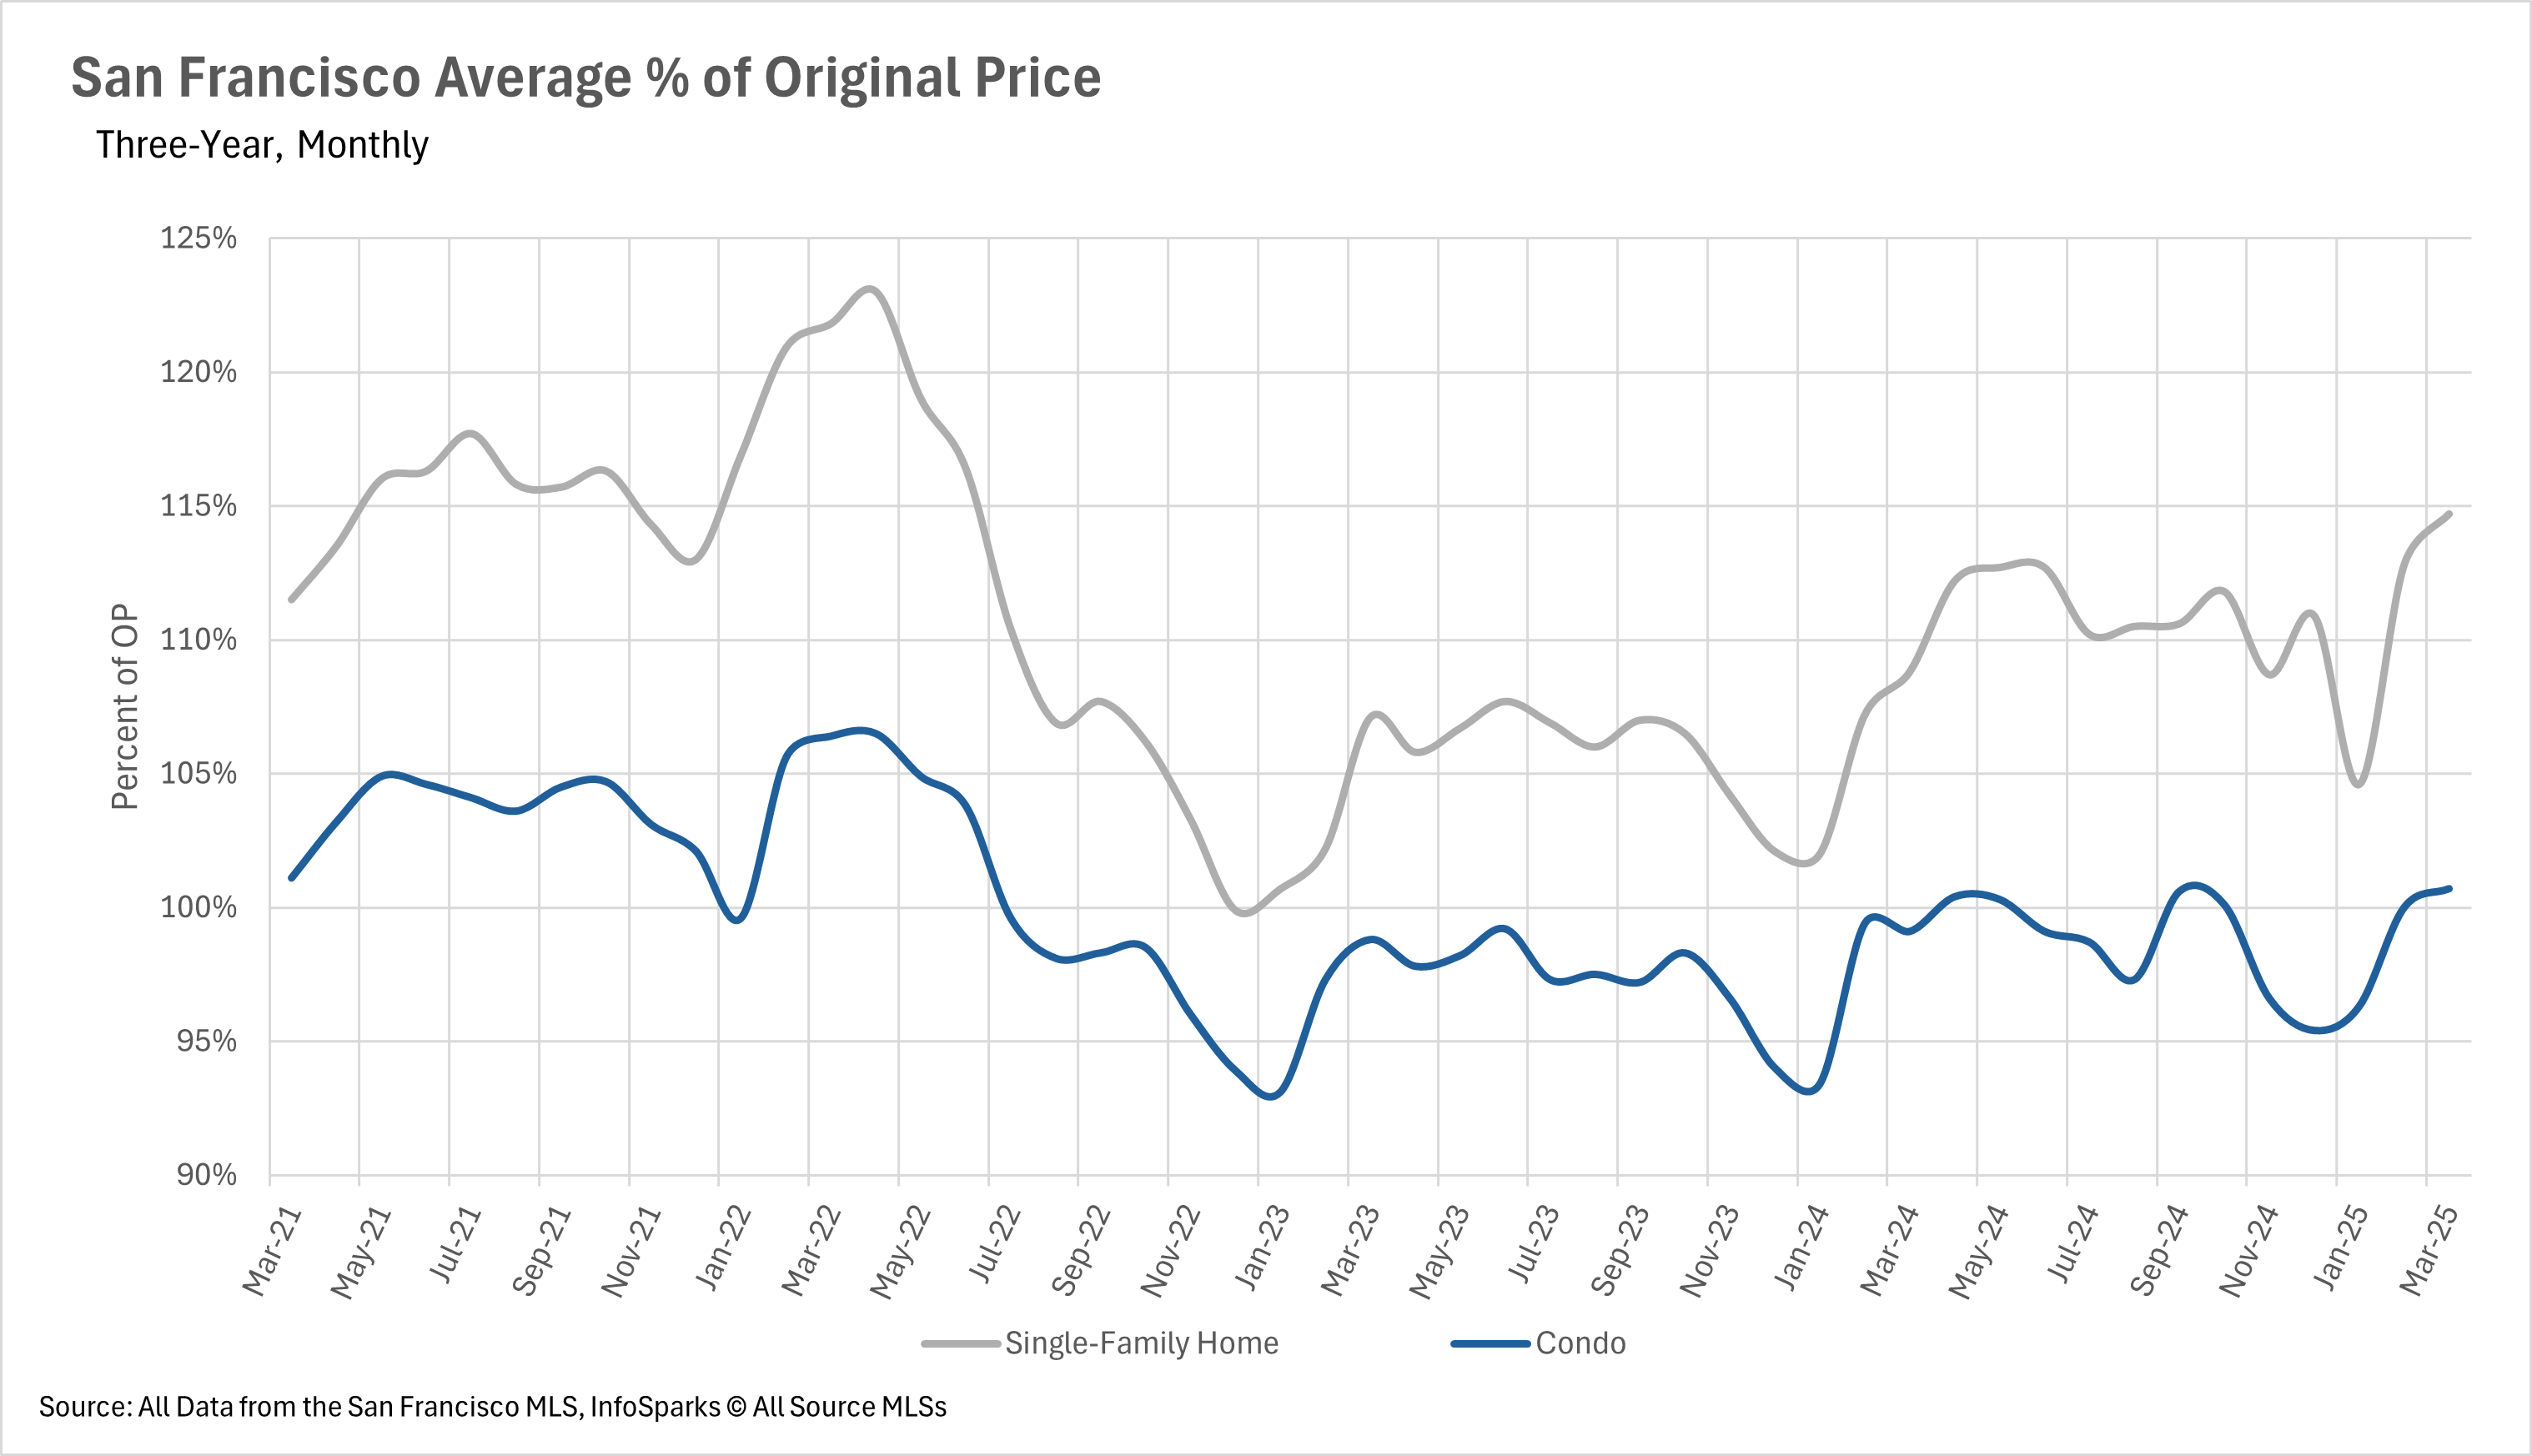
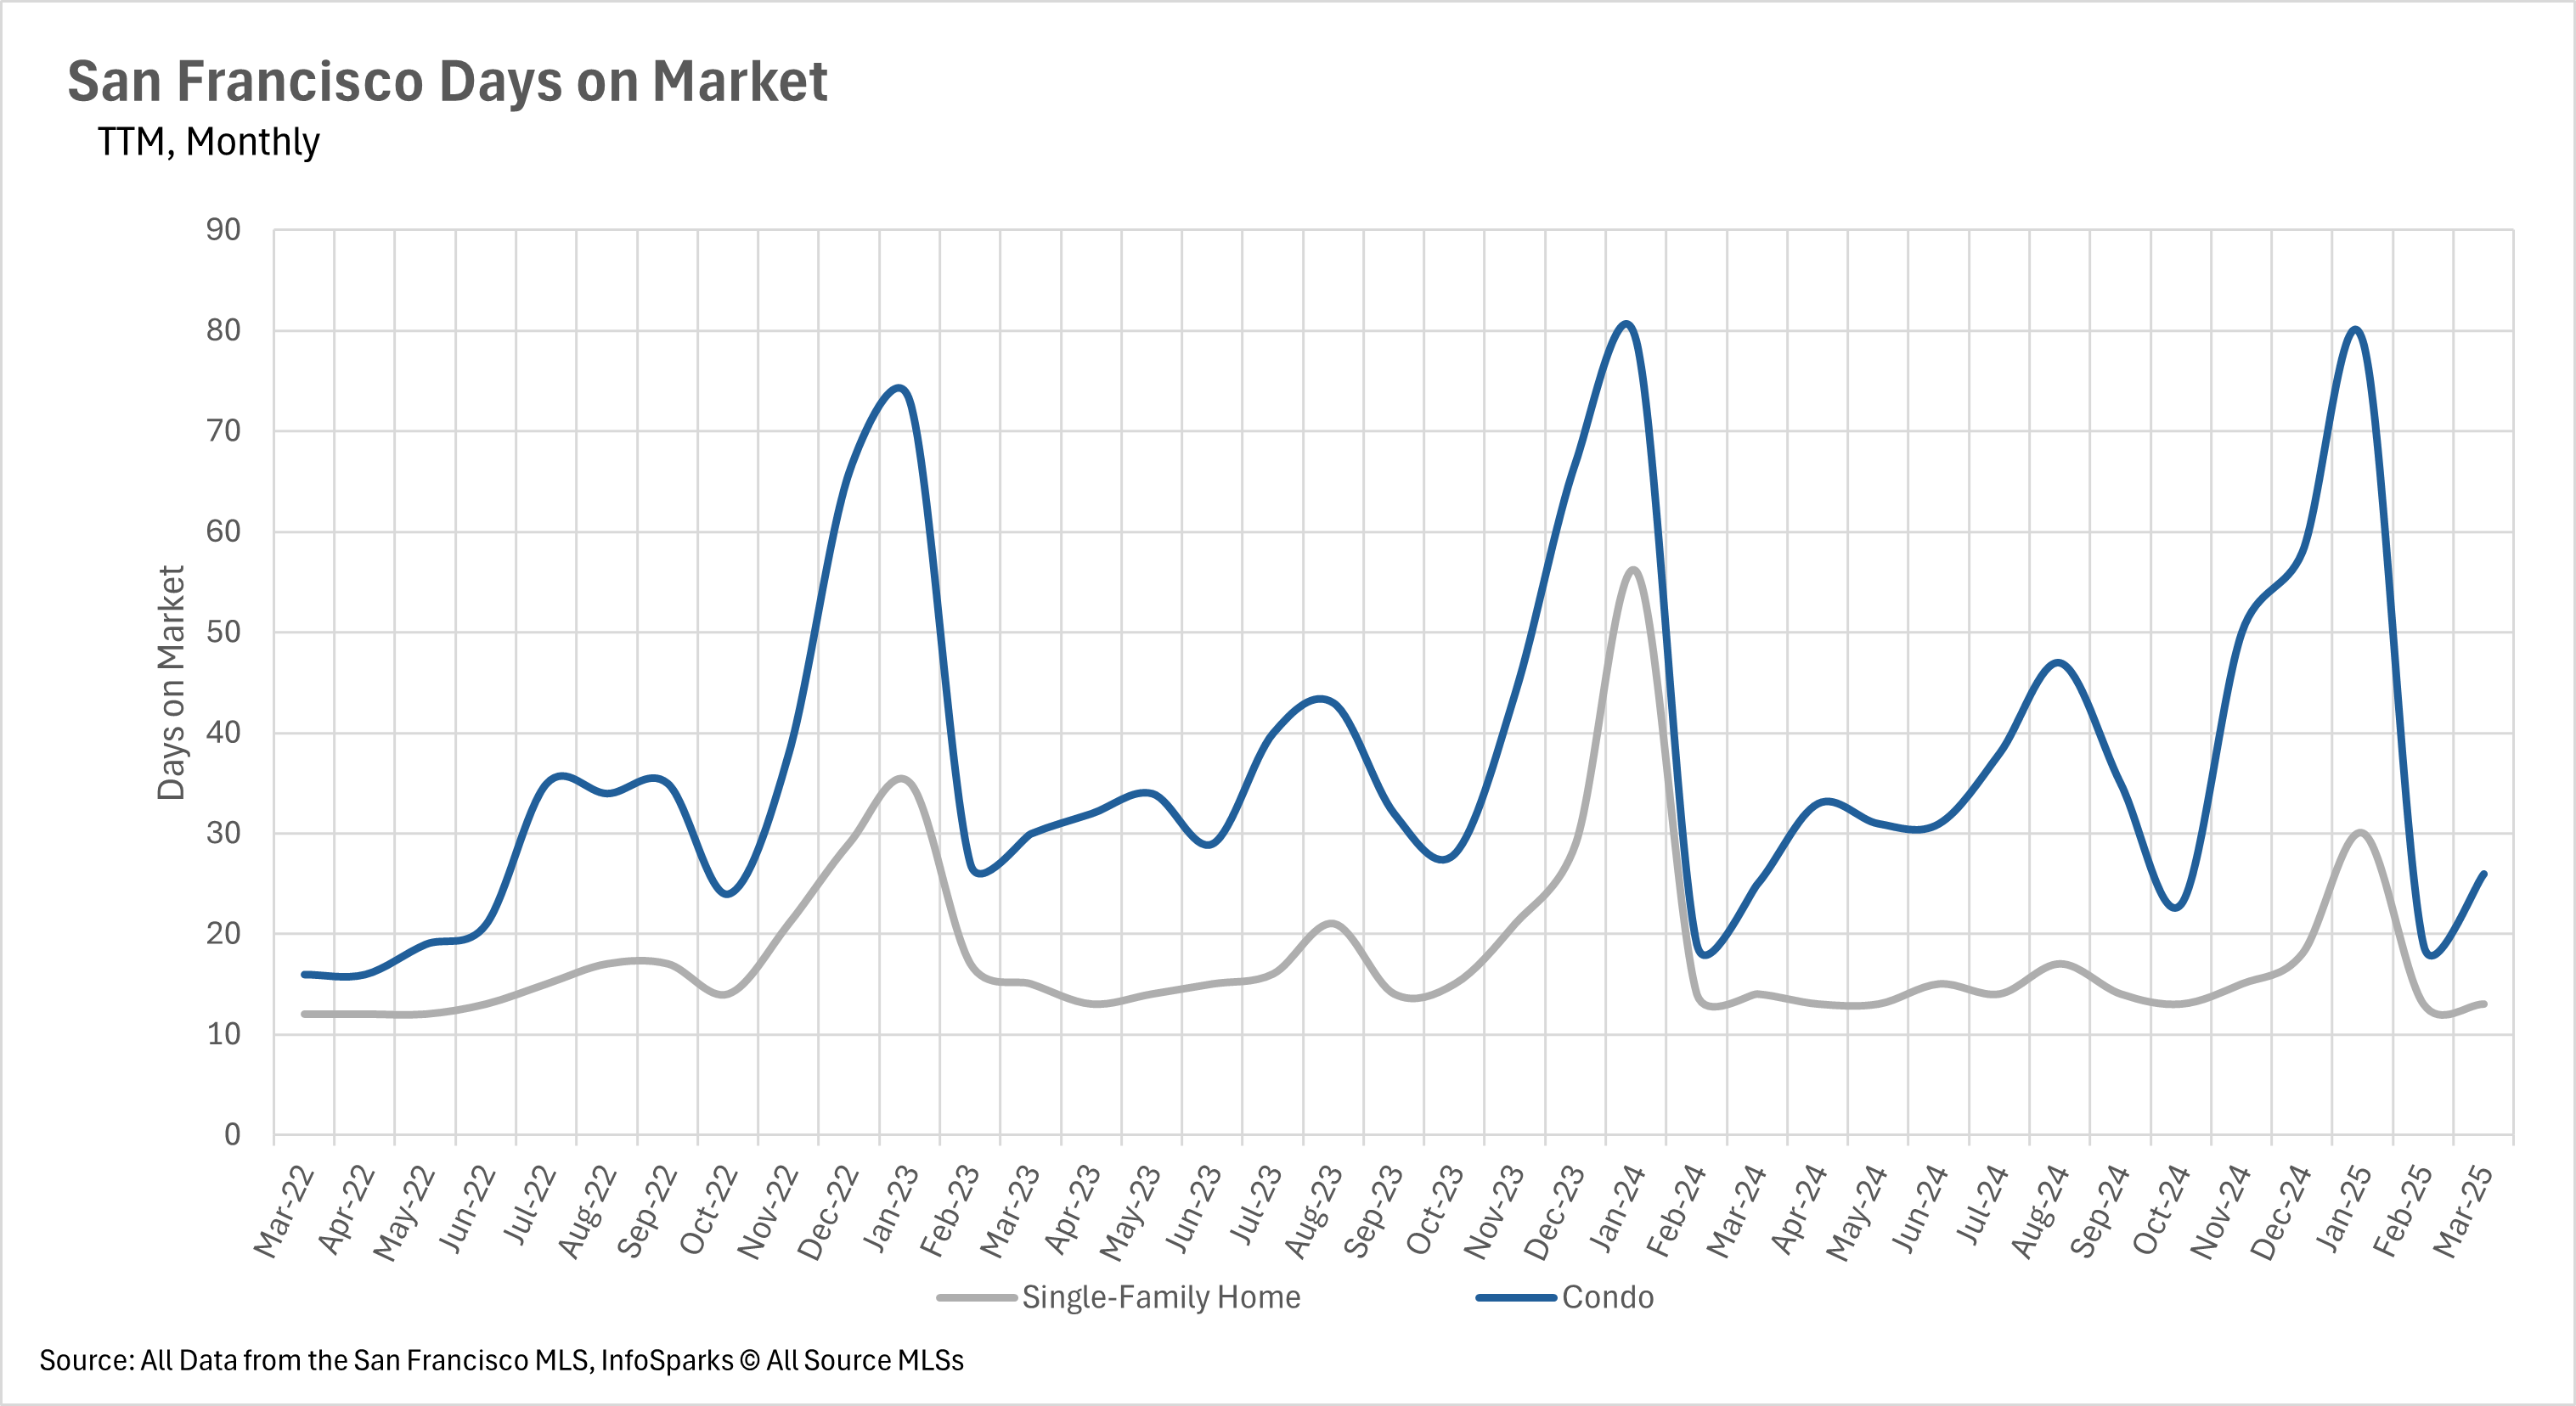
One of the most striking variations across Bay Area markets is the time homes spend on the market before selling. Silicon Valley homes are being snapped up quickly, with the average listing lasting just 8 days in Santa Clara, 10 days in San Mateo, and 16 days in Santa Cruz. The East Bay also shows relatively quick movement with homes typically selling in 12 days in Alameda County and 13 days in Contra Costa County, despite the significant year-over-year inventory increases. In San Francisco, single-family homes are seeing competitive bidding, selling for 114.7% of their original asking price - a level not seen since before the Fed began raising interest rates in June 2022. This contrasts sharply with markets like the North Bay, where homes in Sonoma and Solano counties are spending approximately 15% longer on the market compared to last year.
 

Market balance favors sellers for single-family homes, buyers for condos

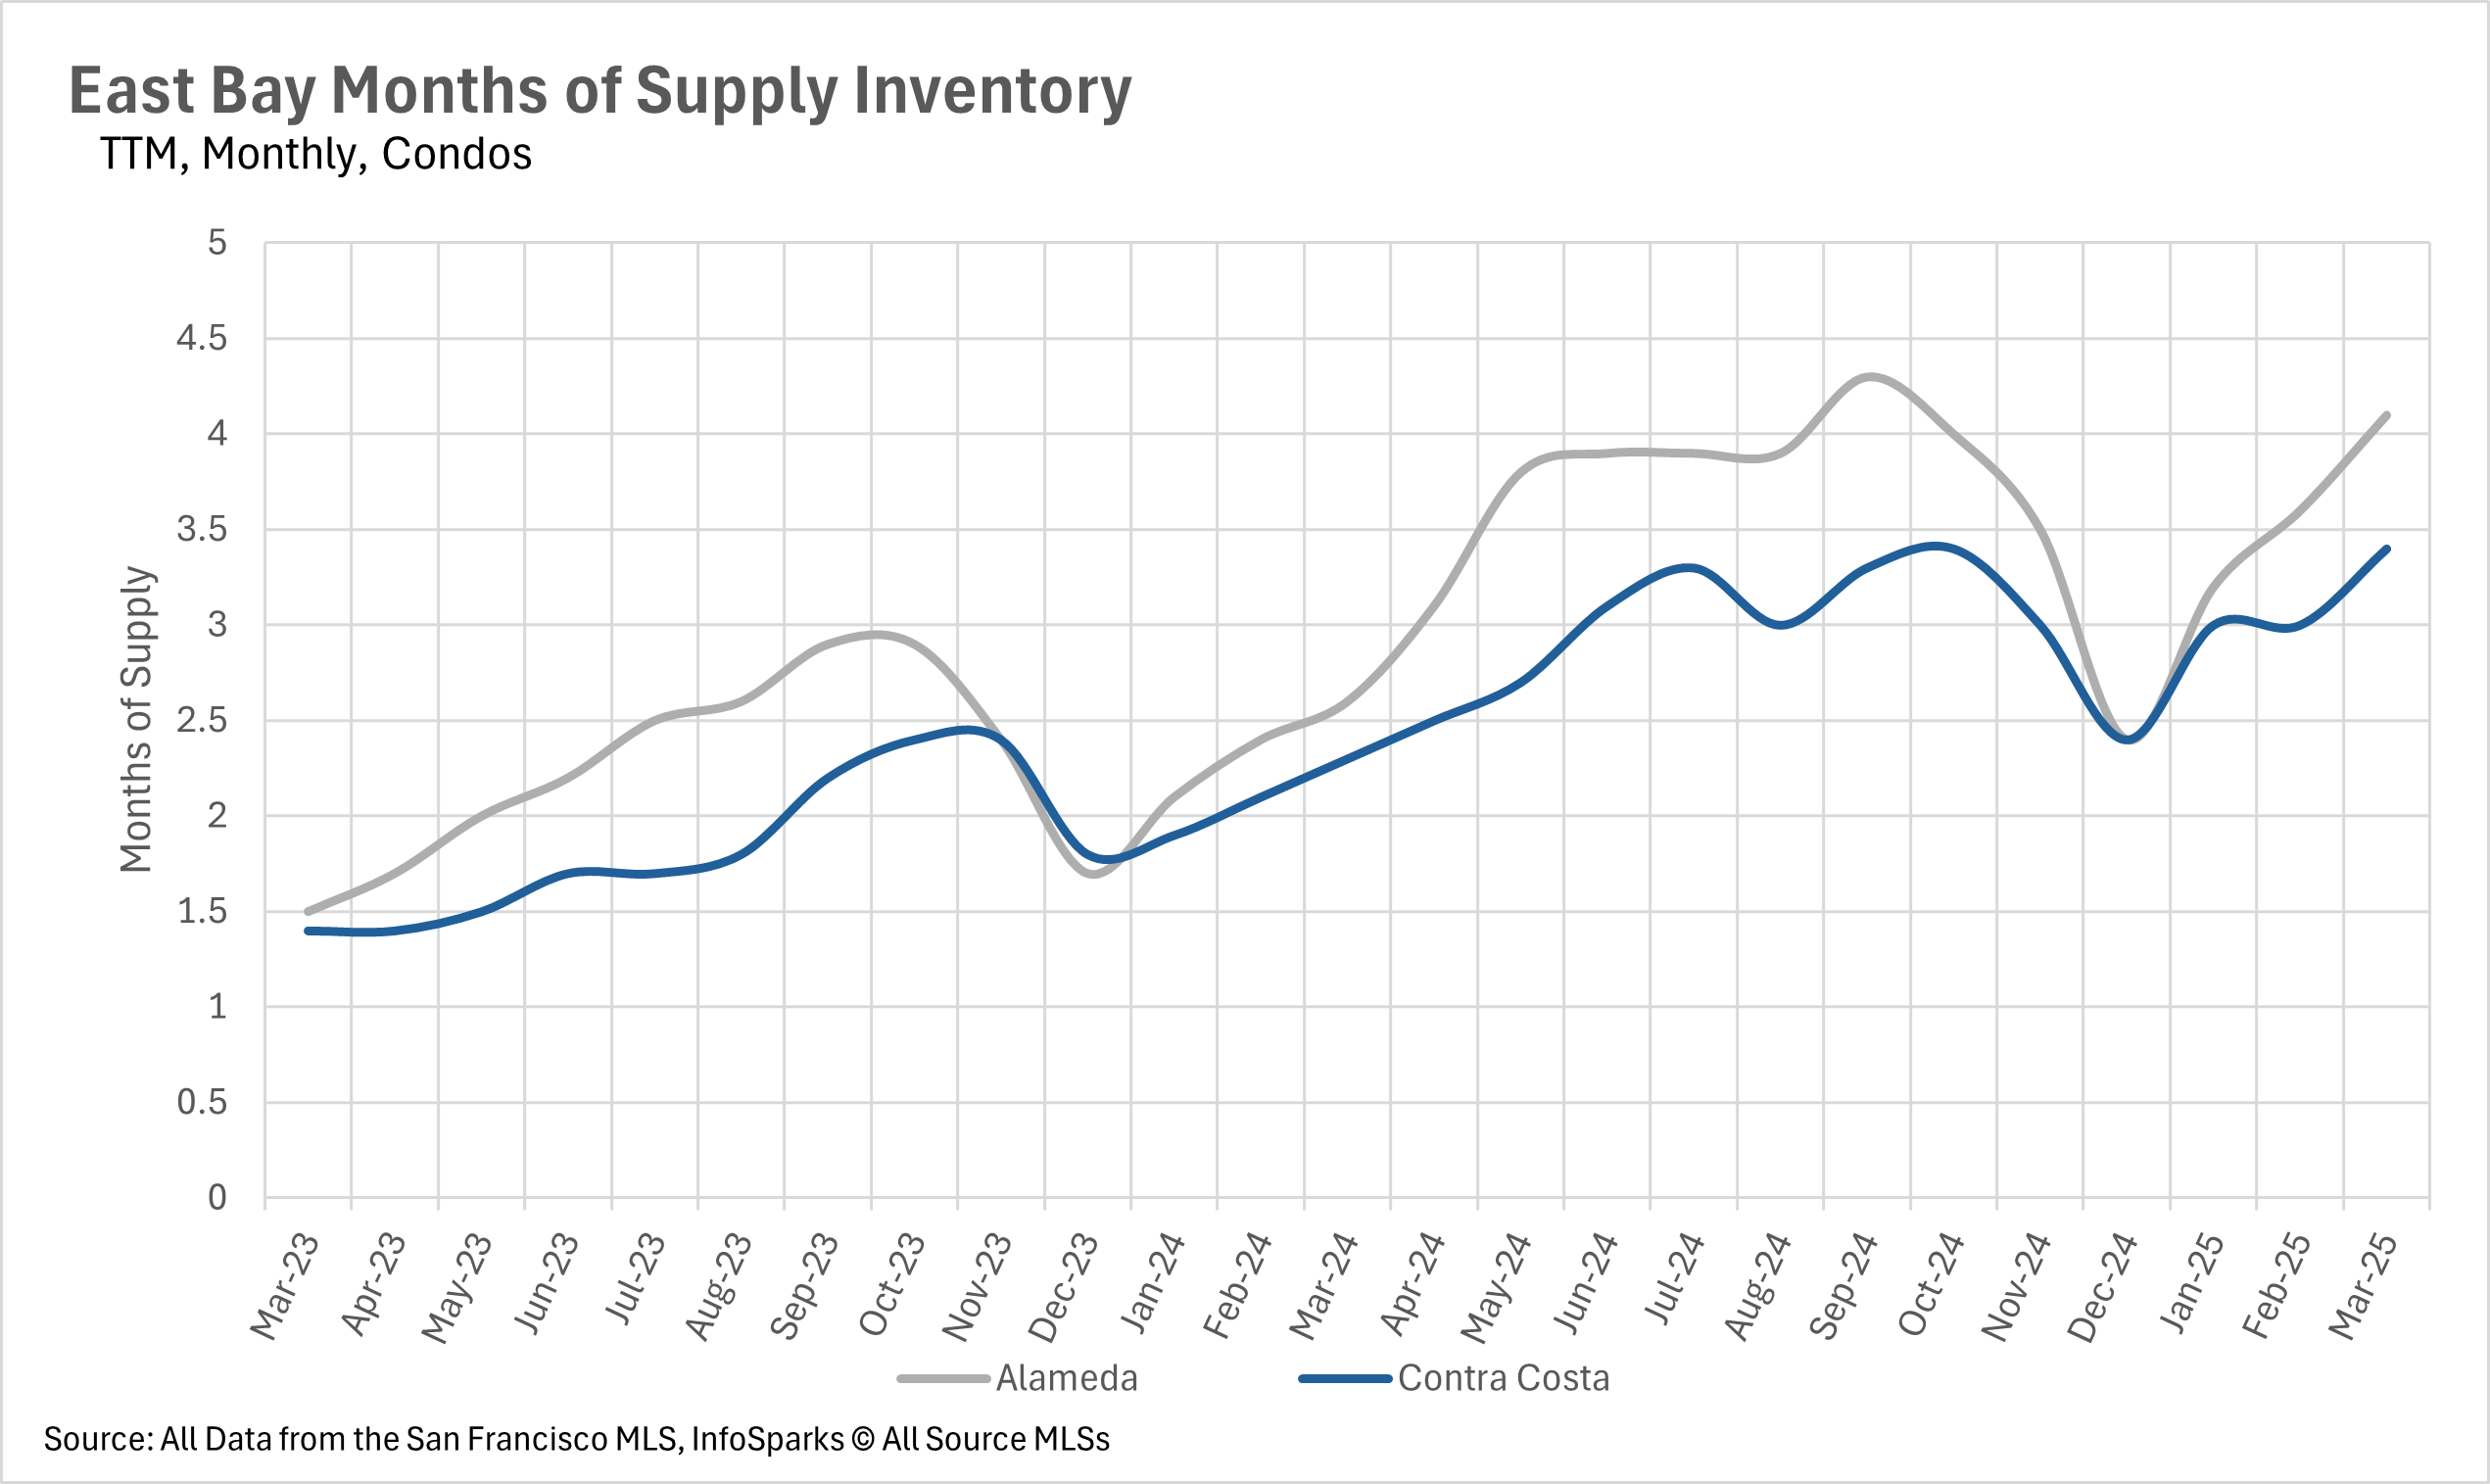
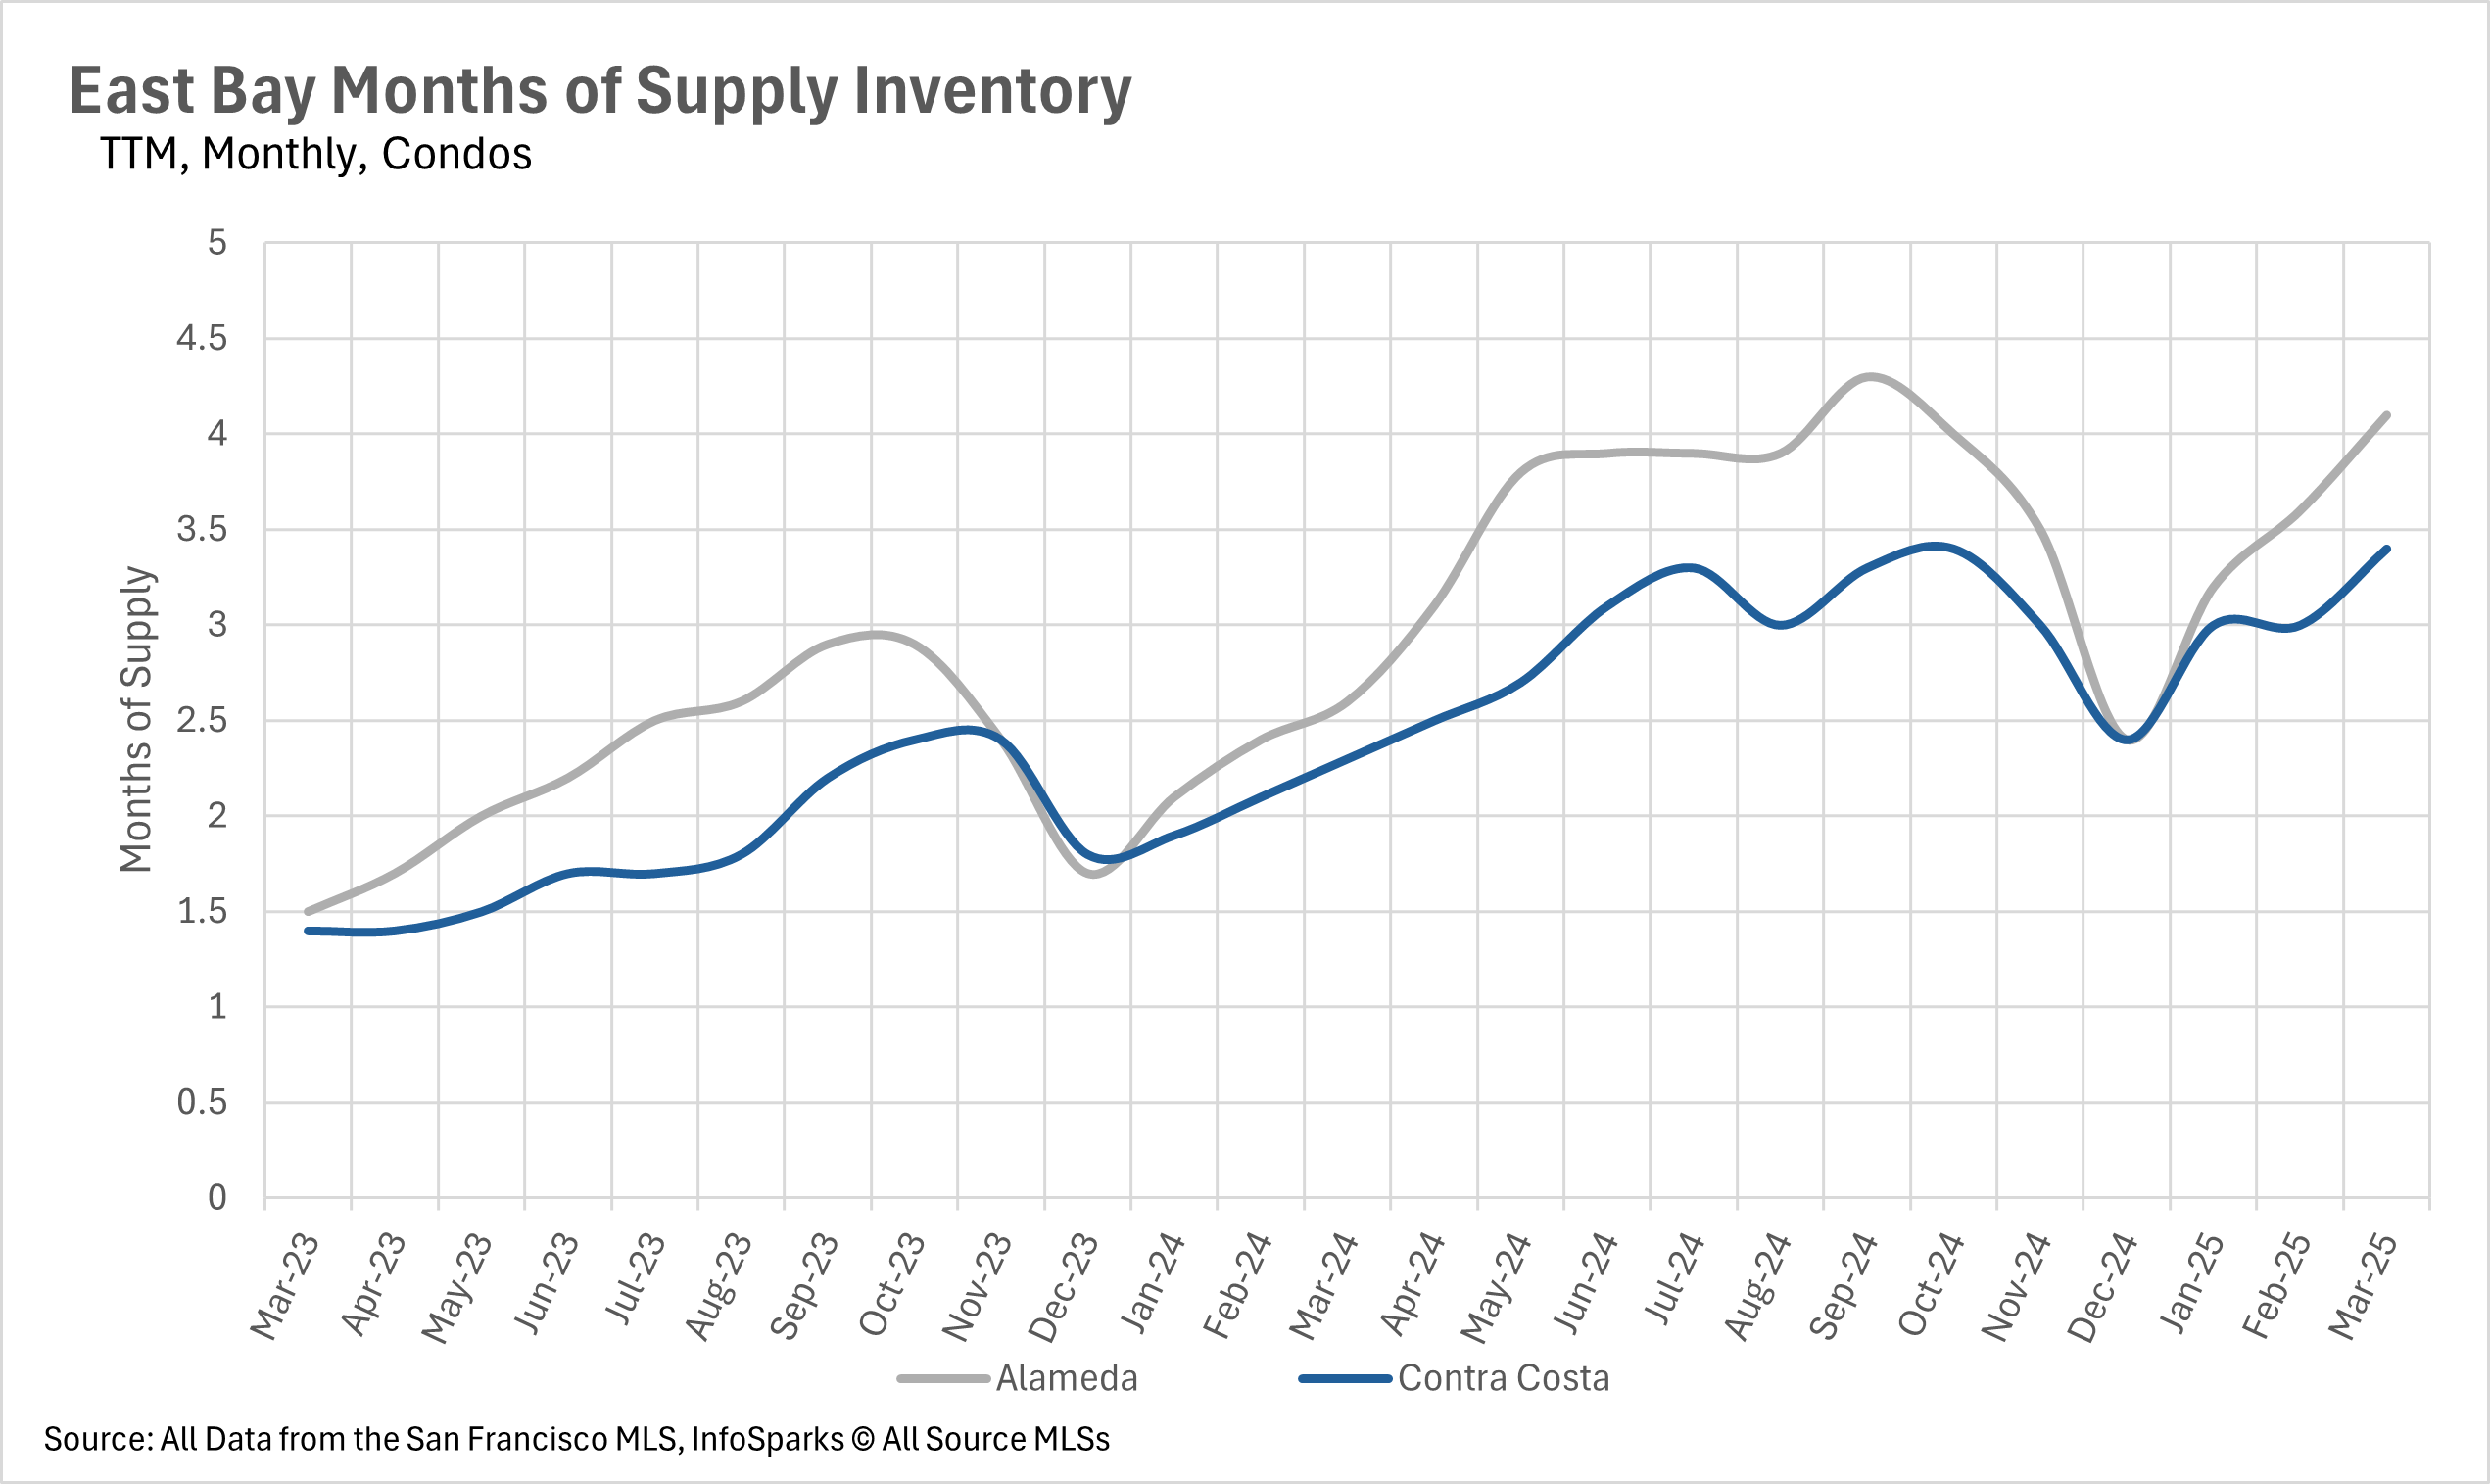
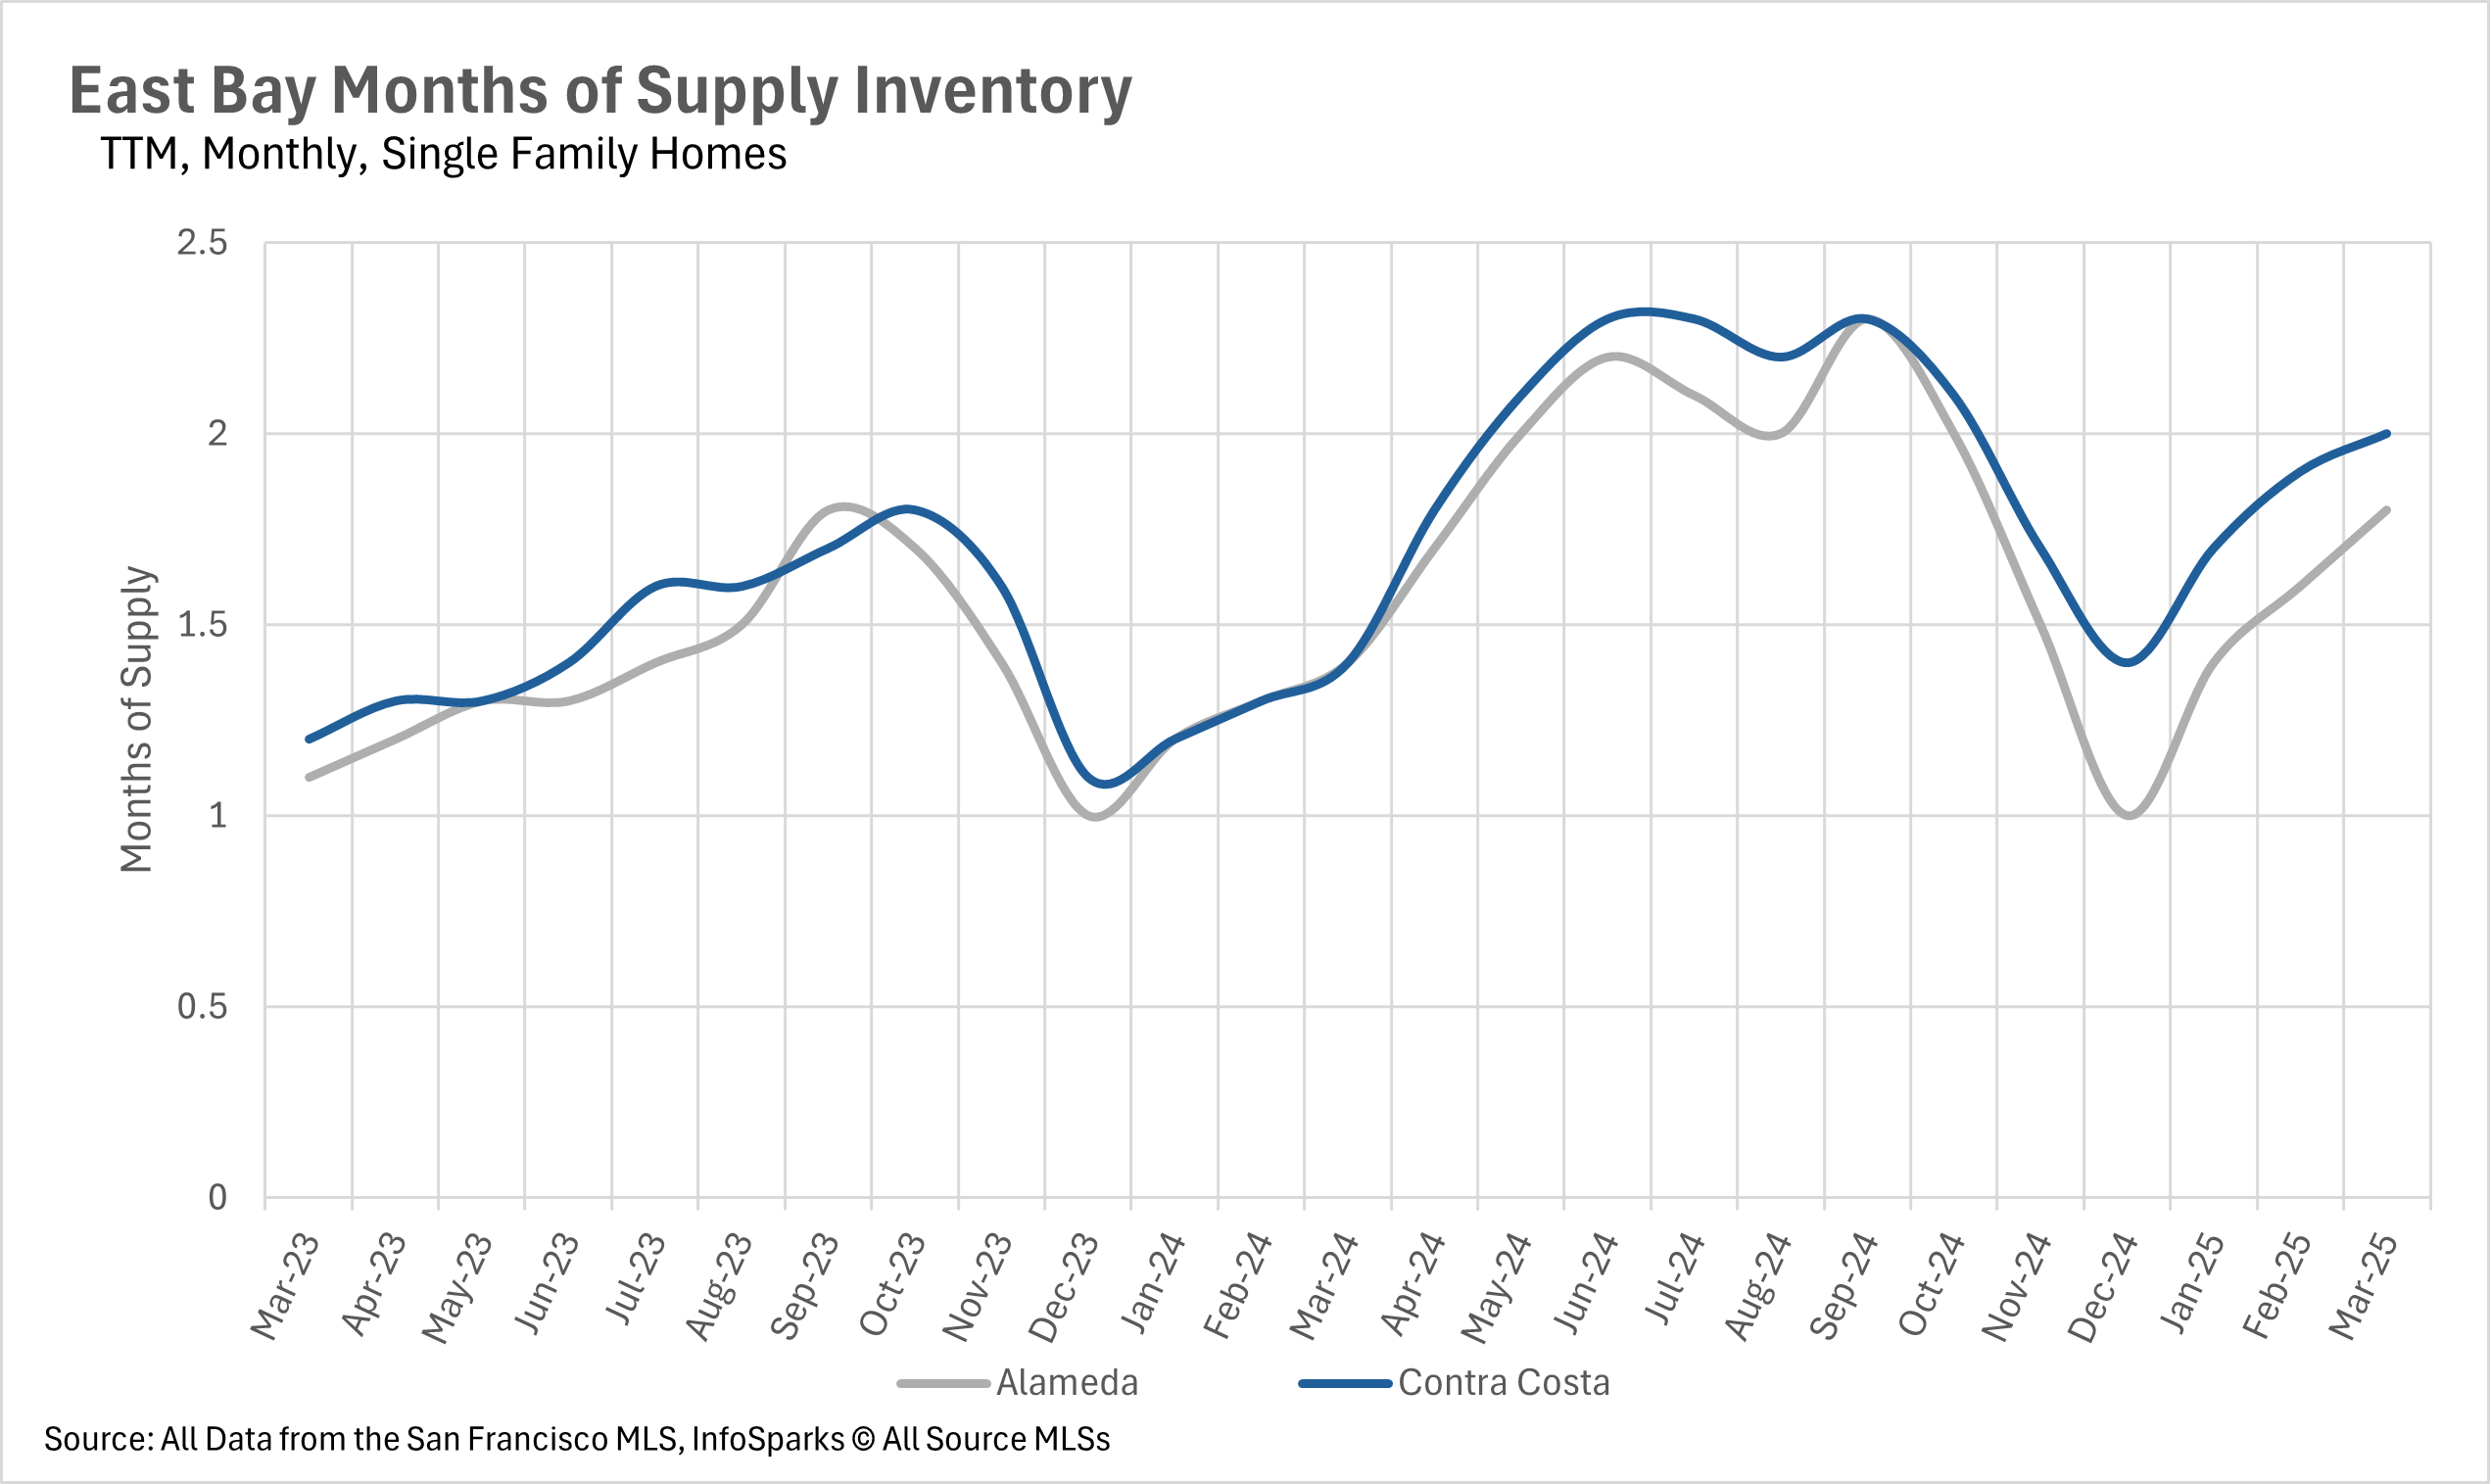
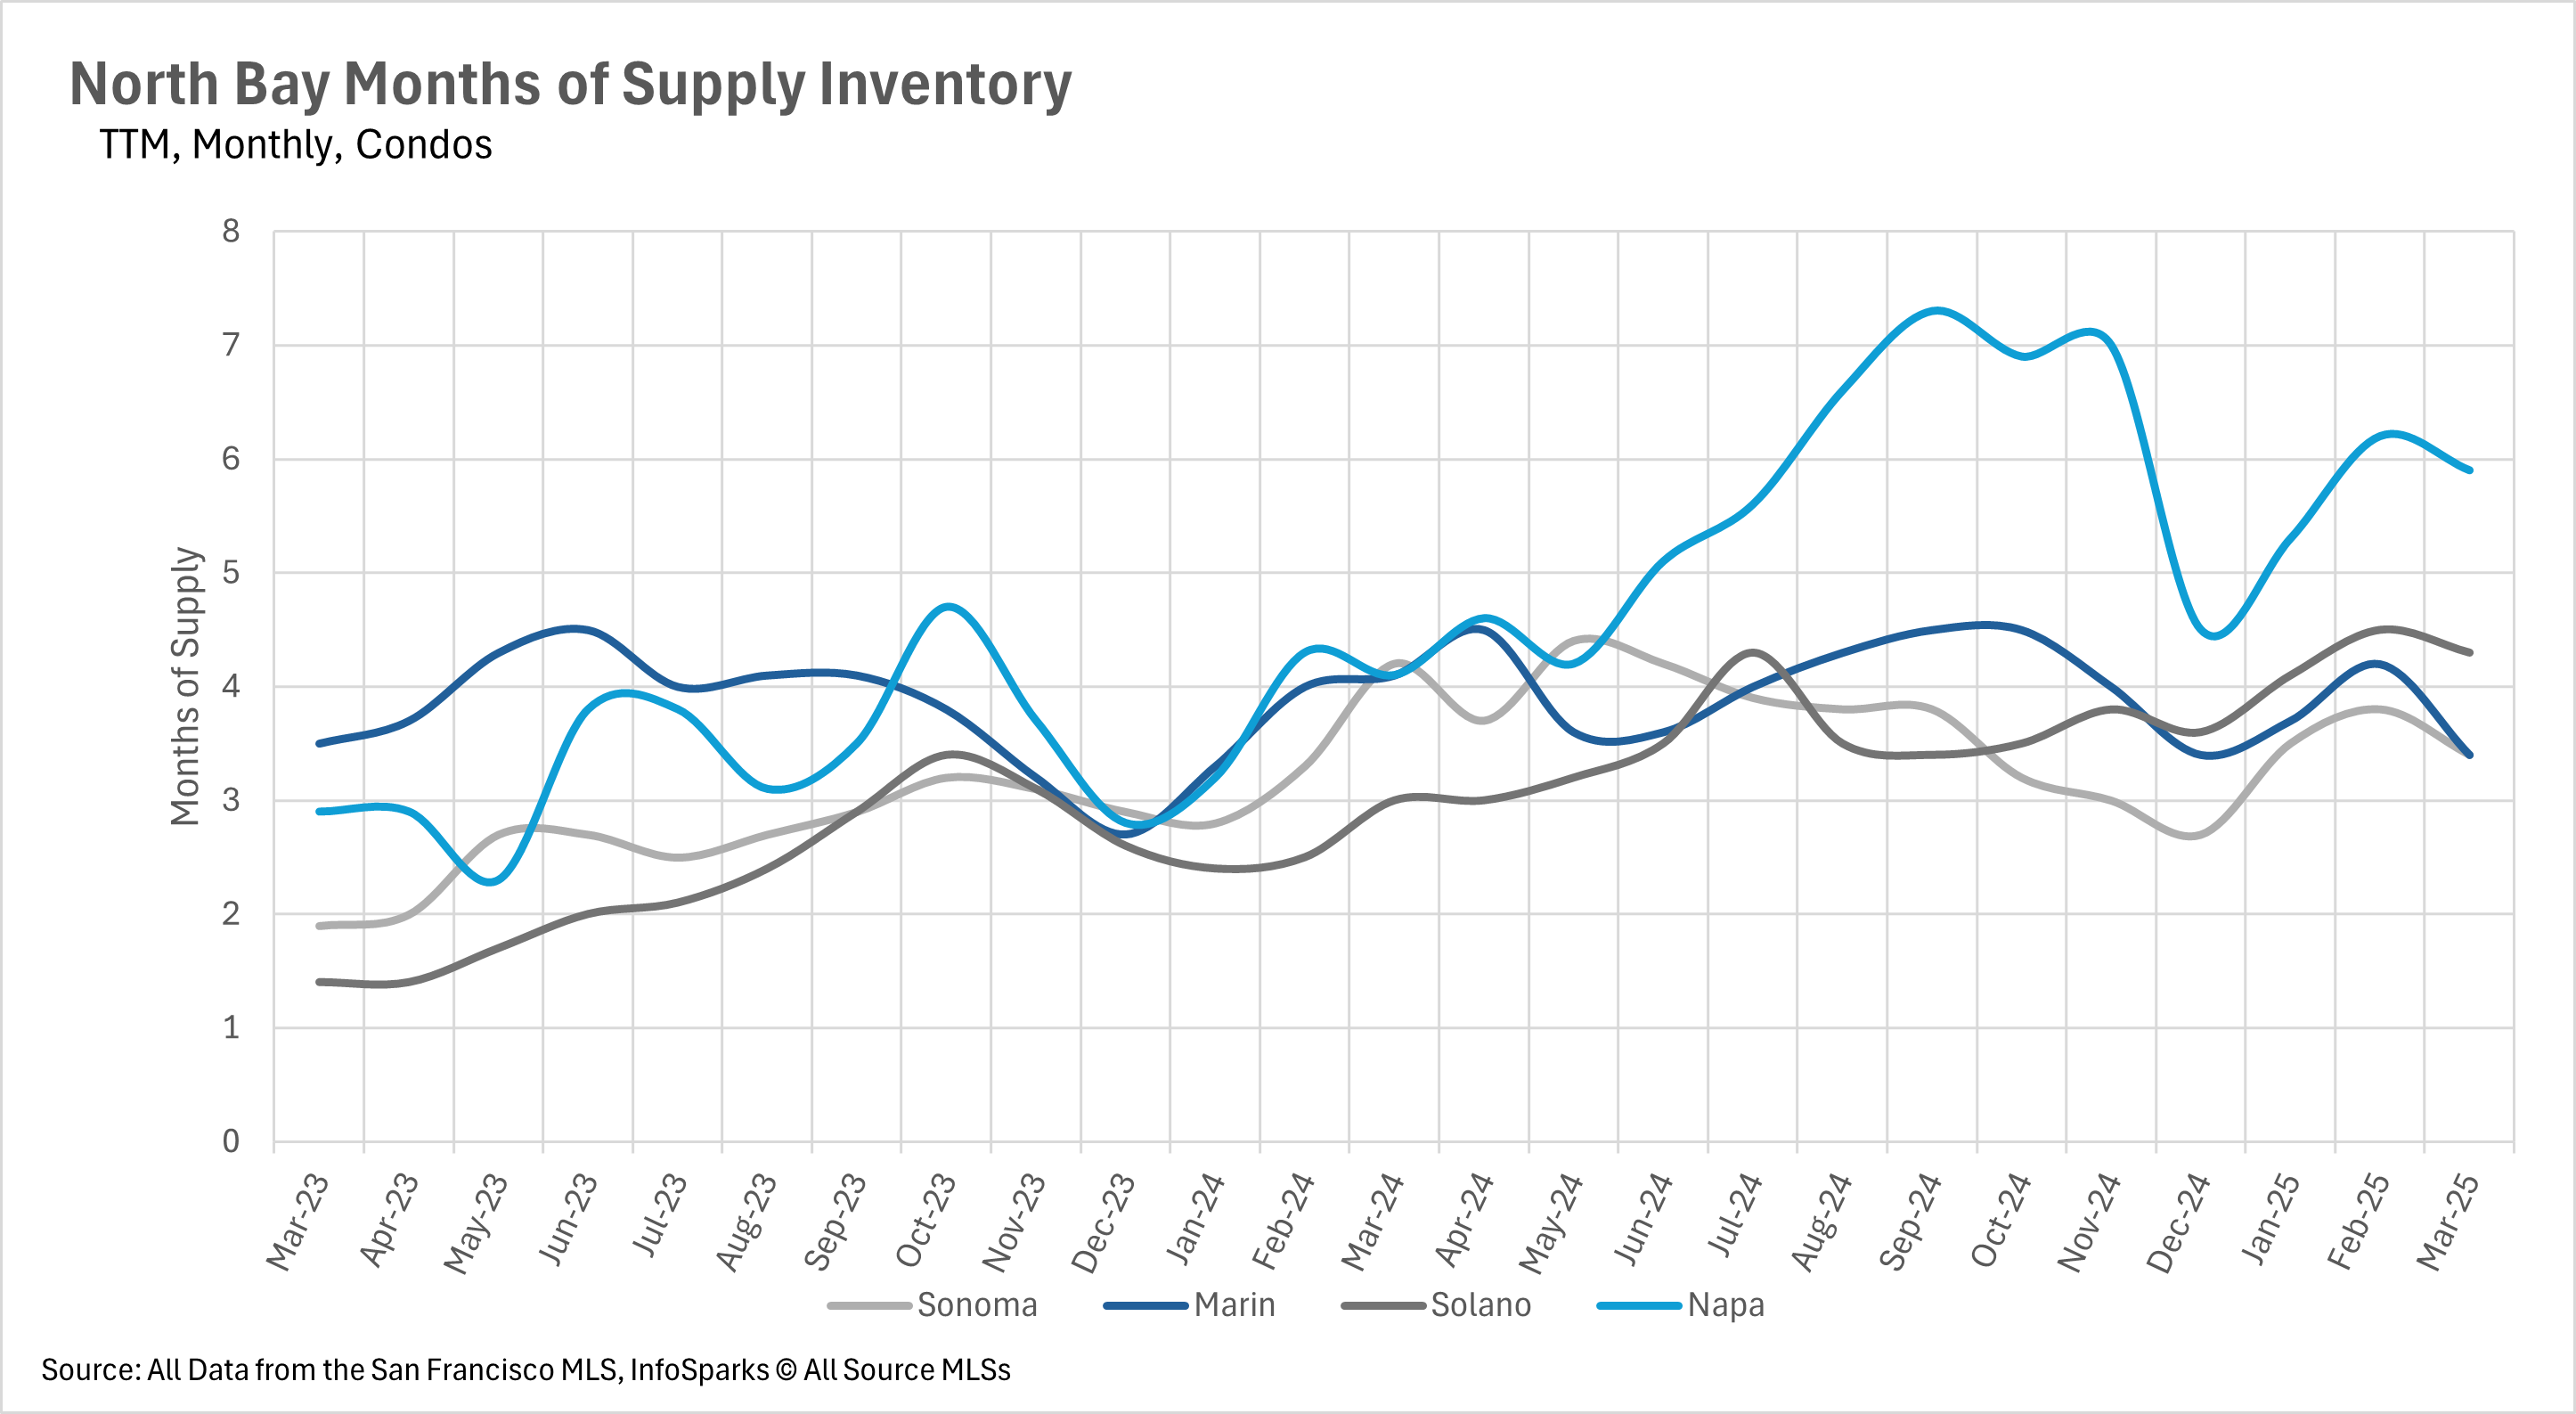
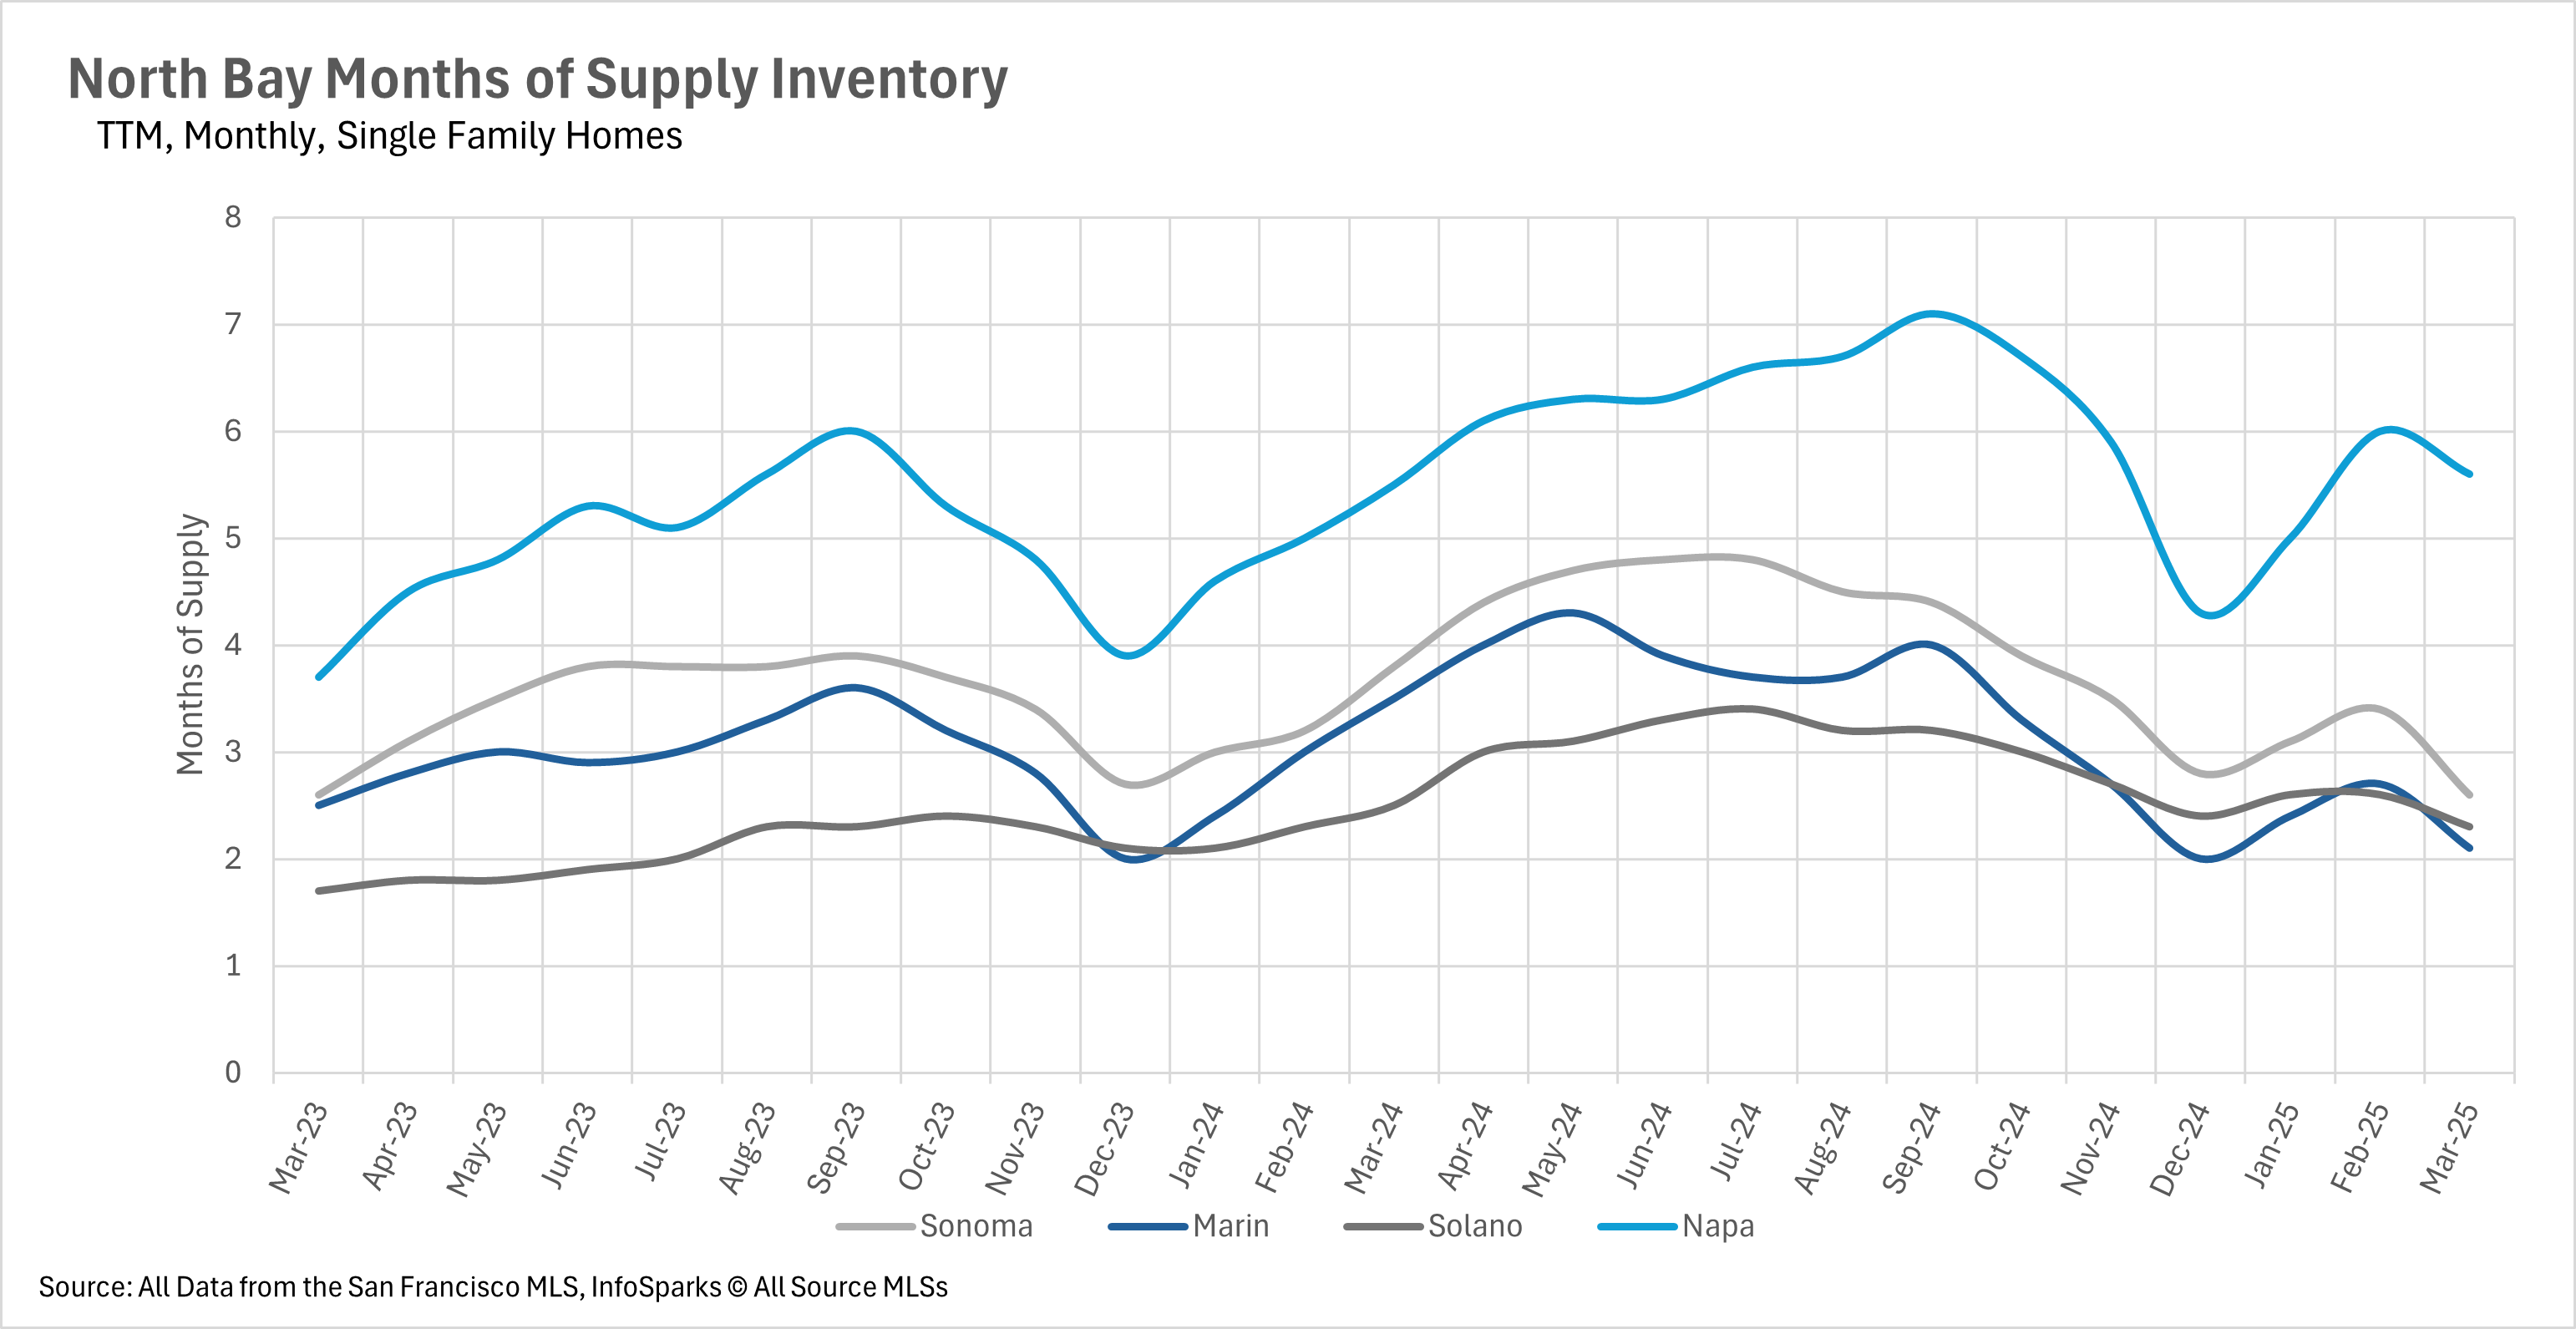
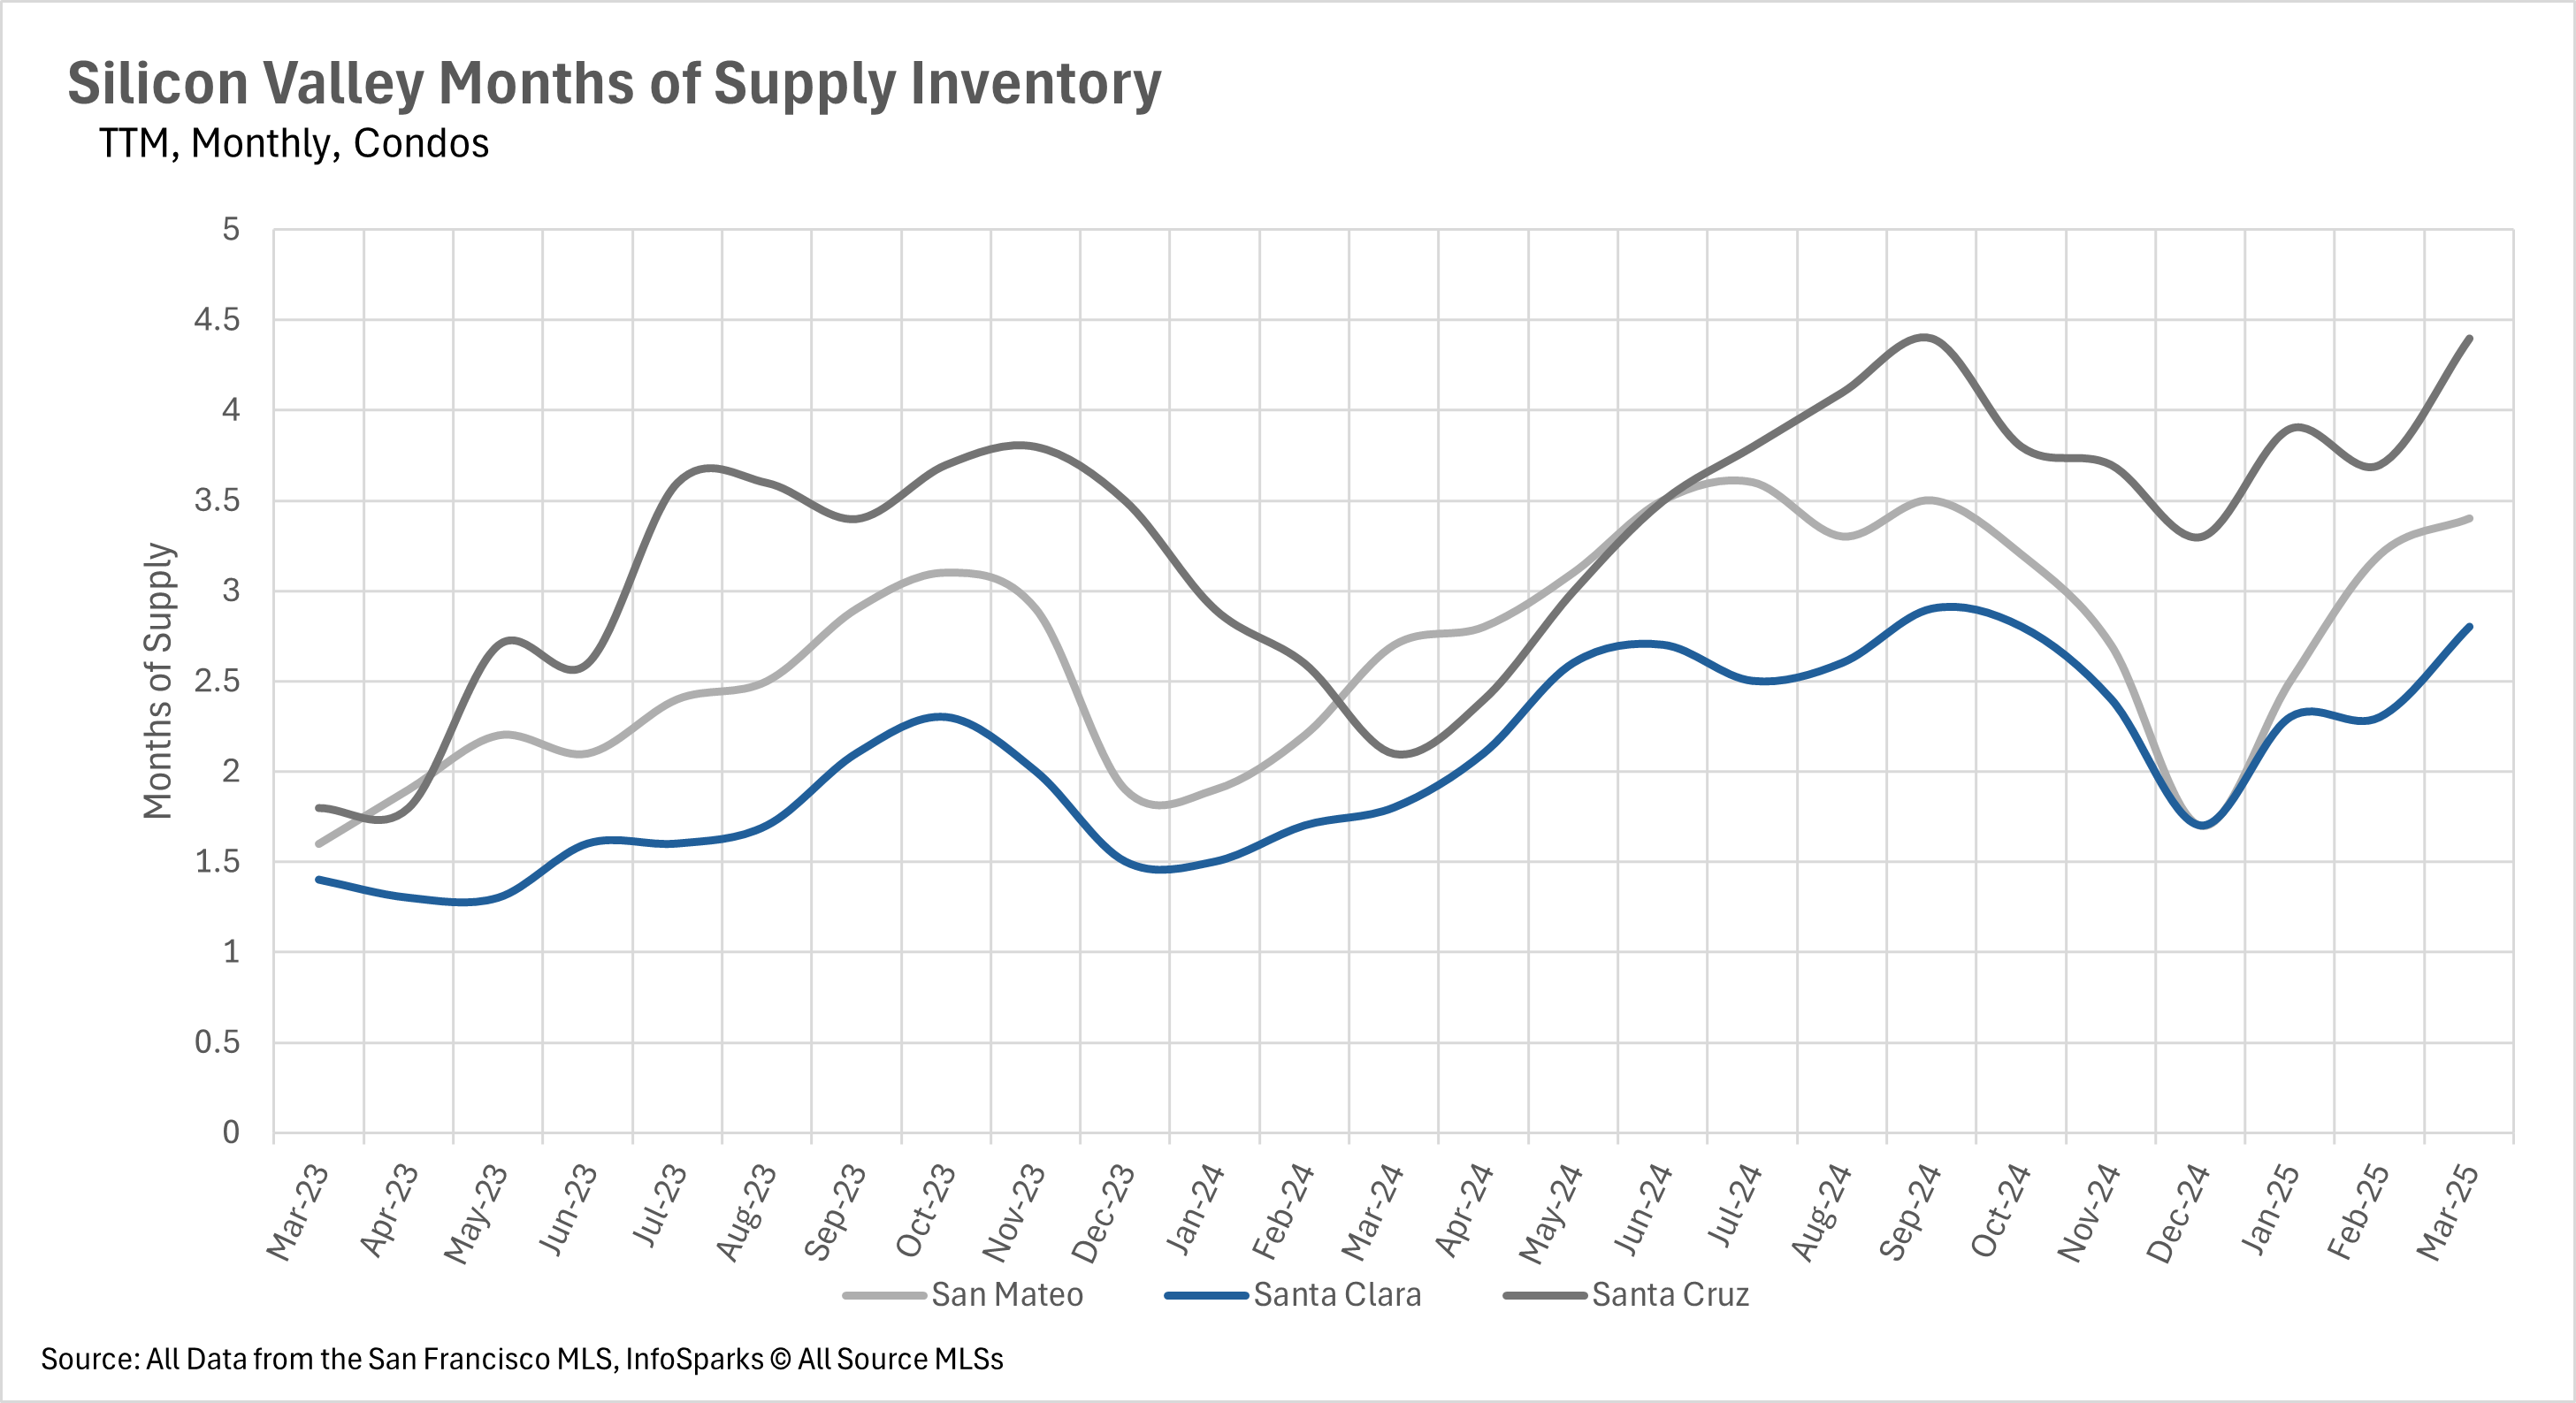
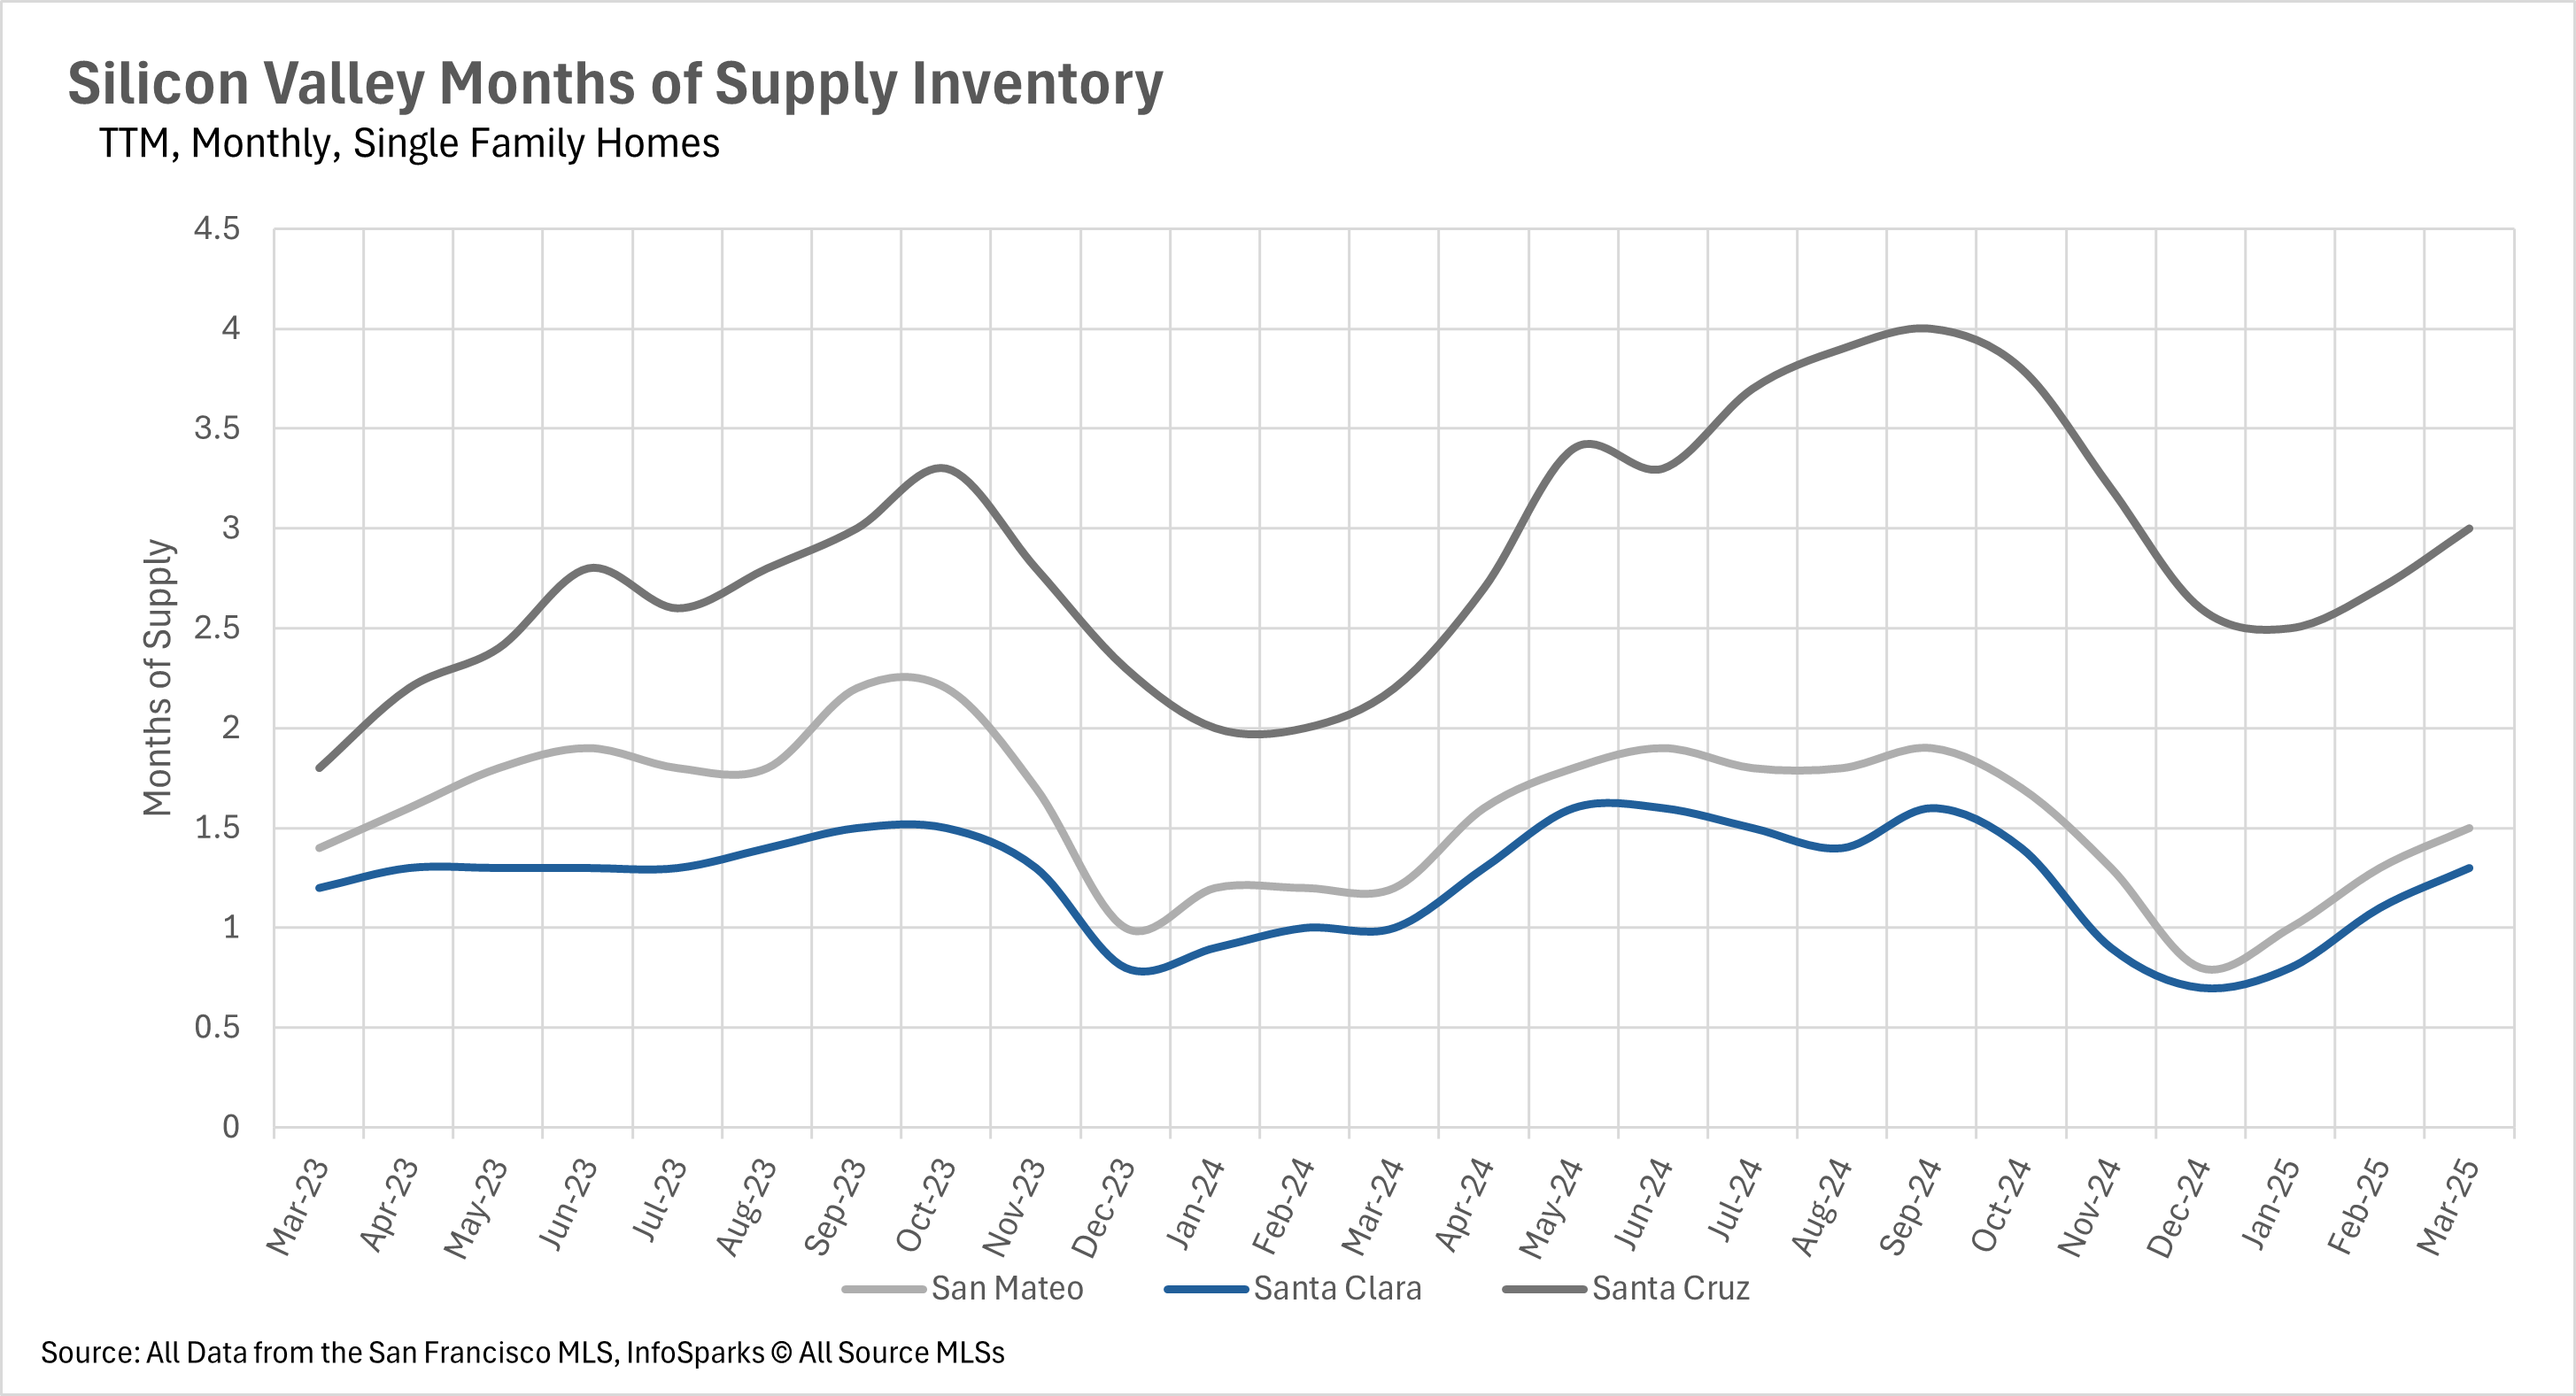
When assessing whether markets favor buyers or sellers, the months of supply inventory (MSI) metric provides clear insights. Historically, California averages around three months of MSI, with lower figures indicating a seller's market and higher figures a buyer's market. Across most of the Bay Area, single-family homes remain firmly in seller's market territory, with Silicon Valley showing just 1.3 months in Santa Clara and 1.5 months in San Mateo (though Santa Cruz is balanced at exactly 3 months). The East Bay reflects similar seller advantage with 1.8 months in Alameda County and 2 months in Contra Costa County. San Francisco has just 1.5 months of single-family home inventory, while most of the North Bay (except Napa County at 5.6 months) also favors sellers. However, the condo market tells a different story, generally favoring buyers with higher inventory levels - 2.8 months in Santa Clara, 3.4 months in San Mateo, 4.4 months in Santa Cruz, 4.1 months in Alameda, 3.4 months in Contra Costa, and 3.7 months in San Francisco. This distinct split between single-family home and condo markets is consistent throughout the Bay Area.
 

Local Lowdown Data
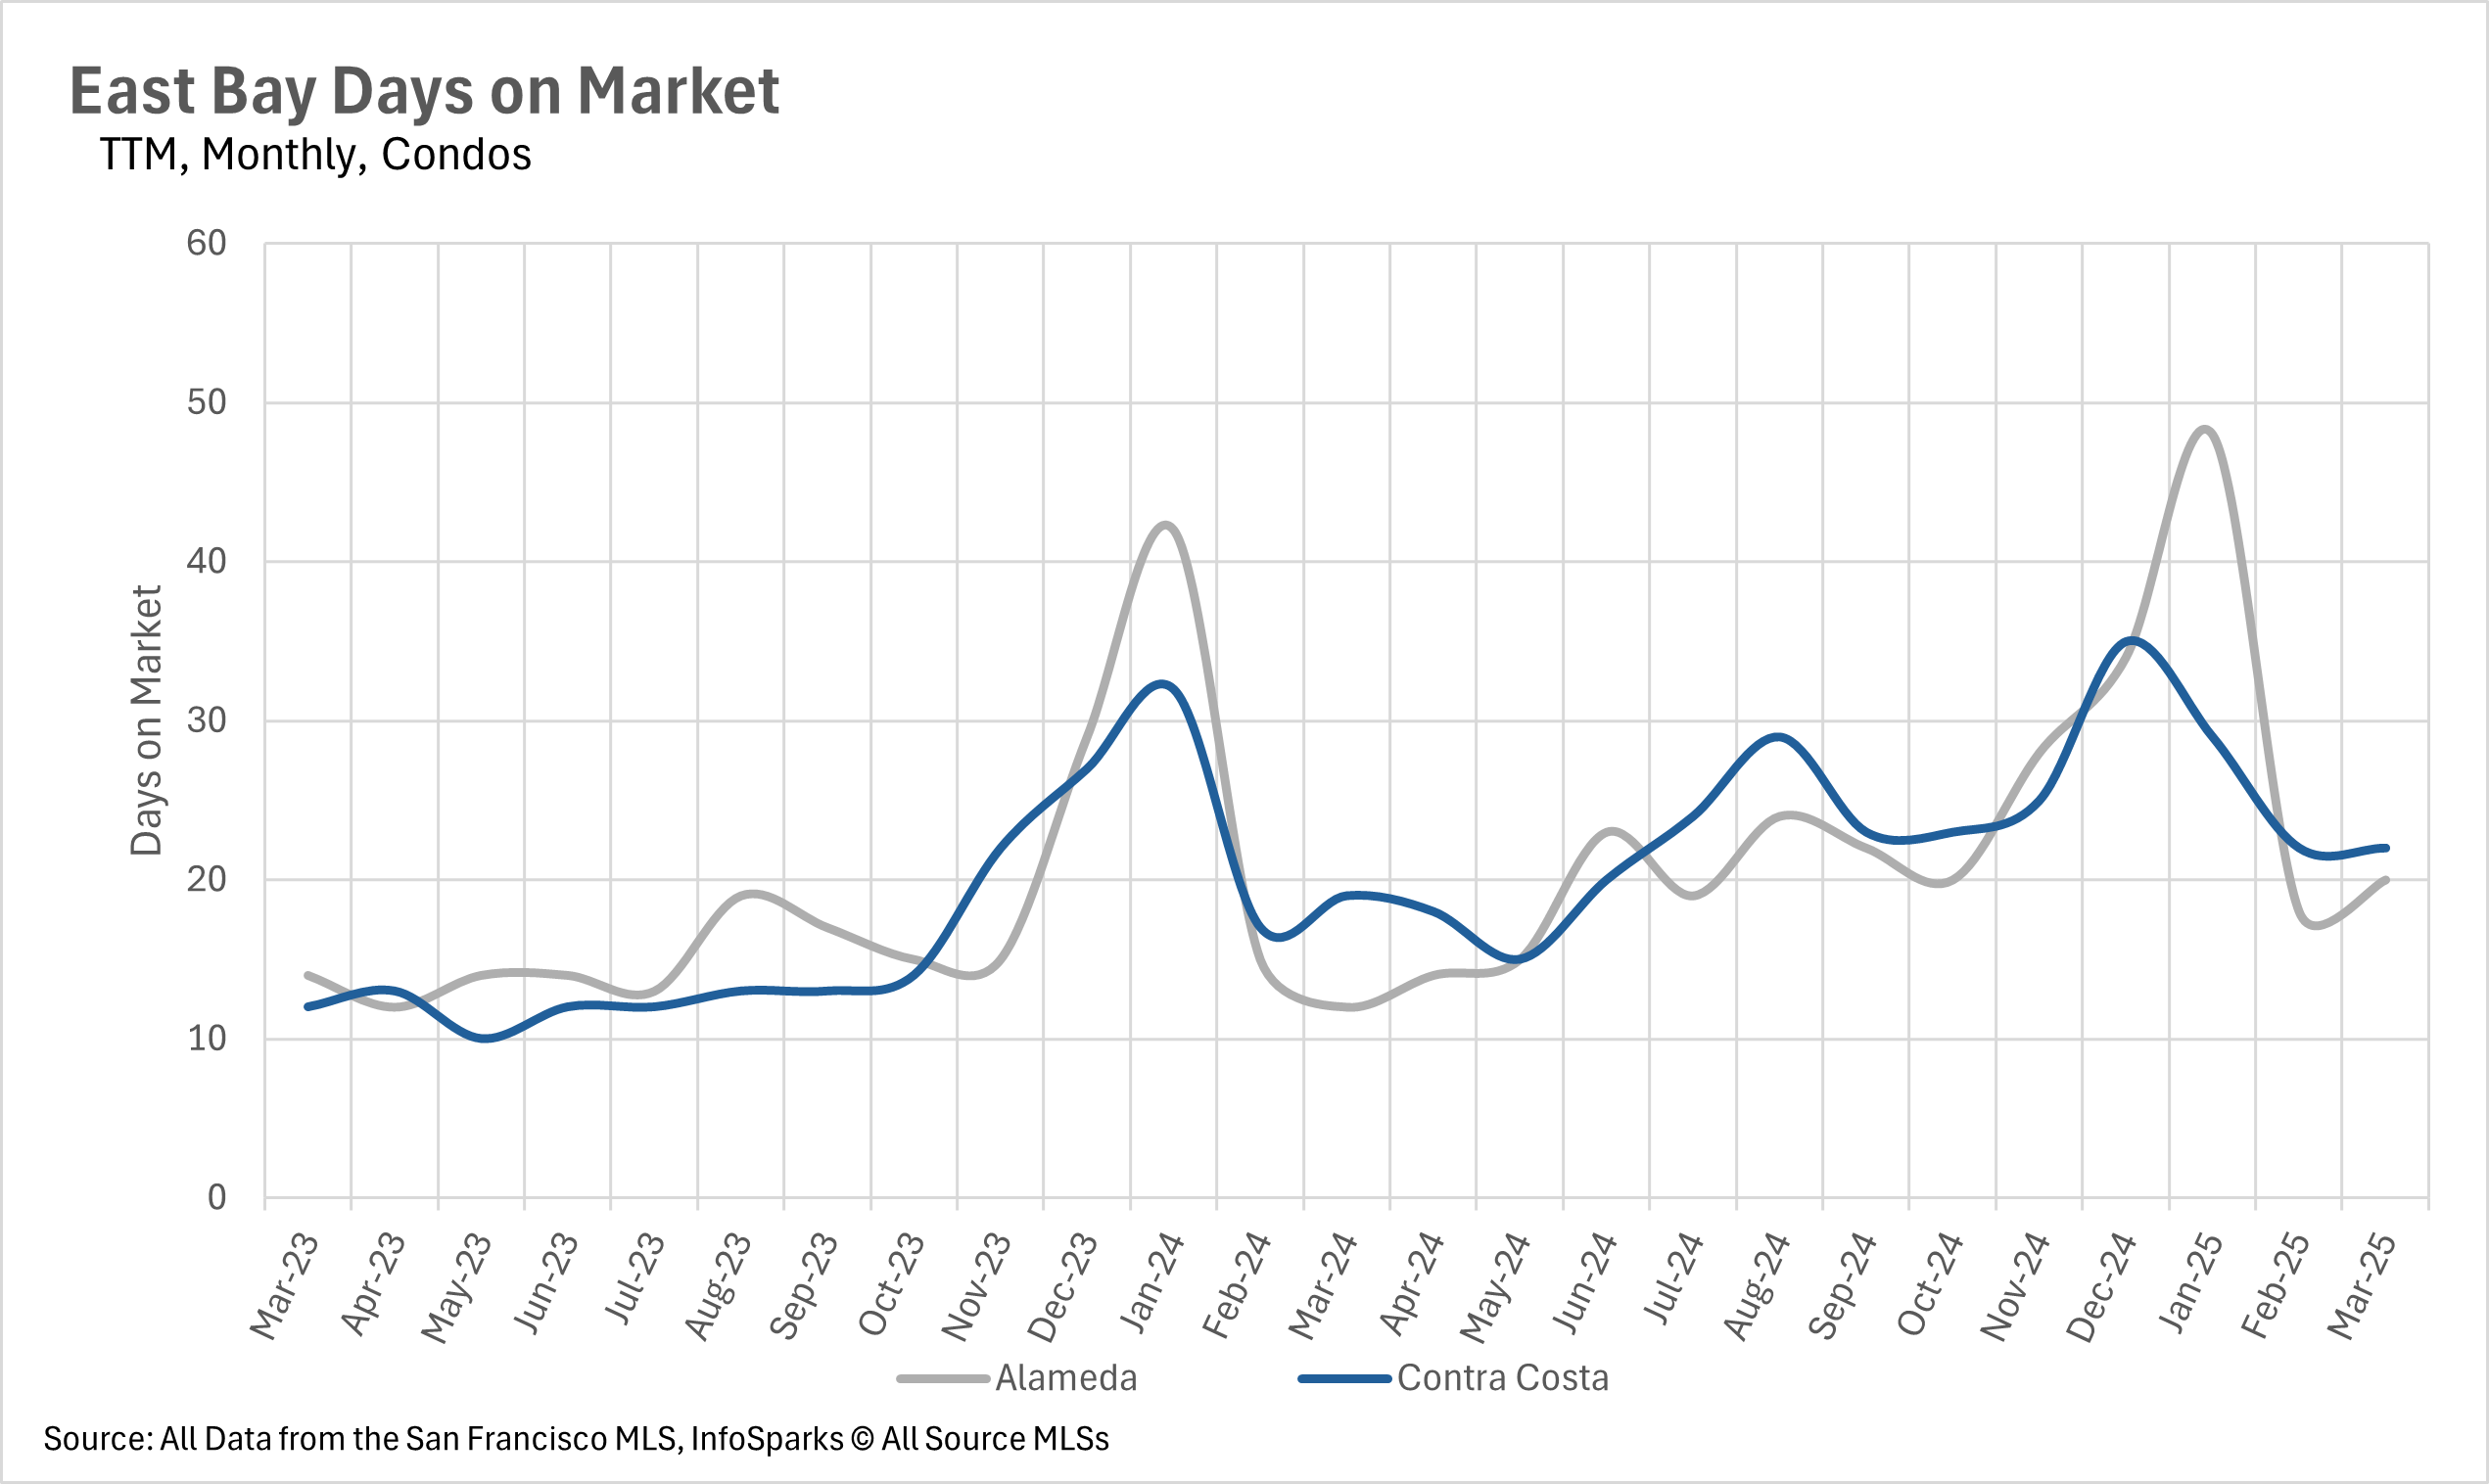
Line chart comparing monthly condo days on market in Alameda and Contra Costa, March 2023 to March 2025.Line chart comparing monthly single-family home days on market in Alameda and Contra Costa, March 2023–March 2025.East Bay condo inventory chart showing monthly new listings, sold listings, and for-sale listings from March 2023 to March 2025.East Bay single-family home inventory chart, March 2023–March 2025, comparing new listings, sold listings, and homes for sale.East Bay condo inventory chart comparing months of supply in Alameda and Contra Costa from March 2023 to March 2025.Line chart of monthly East Bay condo prices, March 2021–March 2025, comparing Alameda and Contra Costa counties.Chart of year-over-year East Bay single-family home price changes in Alameda and Contra Costa counties.Chart of monthly East Bay single-family home prices in Alameda and Contra Costa, March 2021–March 2025.Condo months of supply in Alameda and Contra Costa, March 2023–March 2025.Line chart comparing monthly single-family home inventory supply in Alameda and Contra Costa, March 2023–March 2025.North Bay condo days on market by county, March 2023–March 2025; Napa spikes near 190 days in March 2025.Line chart comparing monthly days on market for single-family homes in four North Bay counties, March 2023–March 2025.North Bay condo inventory chart showing monthly new listings, sold listings, and for-sale listings from March 2023 to March 2025.North Bay single-family home inventory chart showing monthly new listings, sold listings, and homes for sale, March 2023–March 2025.Chart of year-over-year median price changes by county, April 2024–March 2025; Napa shows the largest swings.Line chart of monthly North Bay condo prices by county, March 2022–March 2025; Napa prices fluctuate most sharply.Chart of North Bay single-family home price changes by county, April 2024 to March 2025.Chart of monthly North Bay single-family home prices by county, March 2022 to May 2025.Line chart of monthly North Bay condo supply from March 2023 to March 2025, with Napa peaking above seven months in late 2024.Line chart comparing monthly single-family home inventory across Sonoma, Marin, Solano, and Napa from March 2023 to March 2025.Line chart comparing San Francisco single-family home and condo sale prices as a percentage of original price, March 2021–March 2025.San Francisco days-on-market chart comparing monthly single-family home and condo trends from March 2022 to March 2025.Chart of San Francisco condo listings from March 2021 to March 2025, with new and sold listings and homes for sale.Chart of San Francisco single-family home listings and homes for sale, monthly from March 2021 to March 2025.Chart compares year-over-year San Francisco home and condo median price changes from April 2024 to March 2025.San Francisco monthly median prices chart comparing single-family homes and condos from March 2021 to March 2025.San Francisco monthly housing inventory chart comparing months of supply for condos and single-family homes, 2022–2025.Line chart of monthly trailing-twelve-month condo days on market in San Mateo, Santa Clara, and Santa Cruz, March 2023–March 2025.Line chart of monthly days on market for San Mateo, Santa Clara, and Santa Cruz, March 2023–March 2025.Chart of Silicon Valley condo listings, sales, and homes for sale by month from March 2023 to March 2025.Chart of monthly Silicon Valley single-family home listings and inventory, March 2023 through March 2025.Chart of year-over-year Silicon Valley condo price changes by county from April 2024 to March 2025.Line chart of monthly Silicon Valley condo prices by county, March 2021–March 2025.Bar chart of year-over-year Silicon Valley single-family home price changes by county, April 2024–March 2025.Line chart comparing monthly median single-family home prices in San Mateo, Santa Clara, and Santa Cruz from 2021 to 2025.Line chart of monthly condo inventory supply in San Mateo, Santa Clara, and Santa Cruz, March 2023–March 2025.Line chart comparing months of supply for single-family homes in San Mateo, Santa Clara, and Santa Cruz counties, March 2023–March 2025.

Recent Blog Posts

Stay up to date on the latest real estate trends.

South City neighborhood feature graphic titled “What It’s Actually Like to Call South City Home.”
7 Smart Improvements That Add Real Value to Your Home in San Mateo County

November 9, 2026

What I'd actually put money into before selling, and what can wait

Client story: When the Market Says No: A Short Sale Story
When the Market Says No: A Short Sale Story About Patience and Honest Options

October 31, 2026

What one seller’s short sale taught me about patience, preparation, and giving people the full picture

Client story: The Sale Nobody Wants to Talk About, over an aerial highway view.
When the Market Says No: A Short Sale Story About Patience and Honest Options

October 24, 2026

What one seller’s short sale taught me about patience, preparation, and giving people the full picture

Client story: From a Paused Search to a Brand New Home.
From a Paused Search to a Brand New Home

October 16, 2026

How one referred family took a break, came back with a new plan, and found their fresh start

Client story: An Off-Market Home in Stockton.
An Off-Market First Home in Stockton: What It Taught Me

October 9, 2026

A first-time buyer's story about trust, relationships, and homes that aren’t publicly listed

Investor guide: Your First Investment in Daly City
How to Buy Your First Investment Property in Daly City

October 3, 2026

A step-by-step guide to real estate investing in Daly City, from running the numbers to knowing what the local rules actually allow

Client story: The San Bruno Fixer Sold Before We Met
The San Bruno Fixer That Sold Before We Ever Met in Person

September 26, 2026

How an inherited family home, rented for more than 20 years, found the right buyer at a price that worked for my seller

Hayward vs. Richmond East Bay comparison guide
Hayward vs. Richmond: Which East Bay City Gives You More for Your Money?

September 17, 2026

A side-by-side look at home prices, rent, taxes, utilities, schools, and everyday life in two popular East Bay alternatives to San Francisco and the Peninsula

Real estate guide: “What to Know This Indian Summer,” by Guillean Arradaza | Kinetic Real Estate.
Is Now a Good Time to Buy or Sell in the Bay Area? Here's What to Know This Indian Summer

September 12, 2026

A straight look at Peninsula pricing, rates, and seasonal timing as of September 2026, plus what I'd tell you if you were sitting across from me.

Let's Talk

You’ve got questions and we can’t wait to answer them.