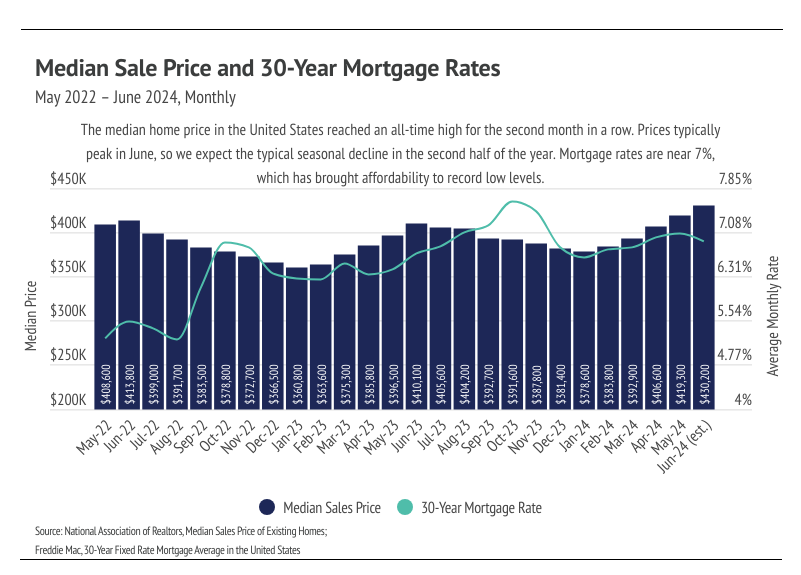
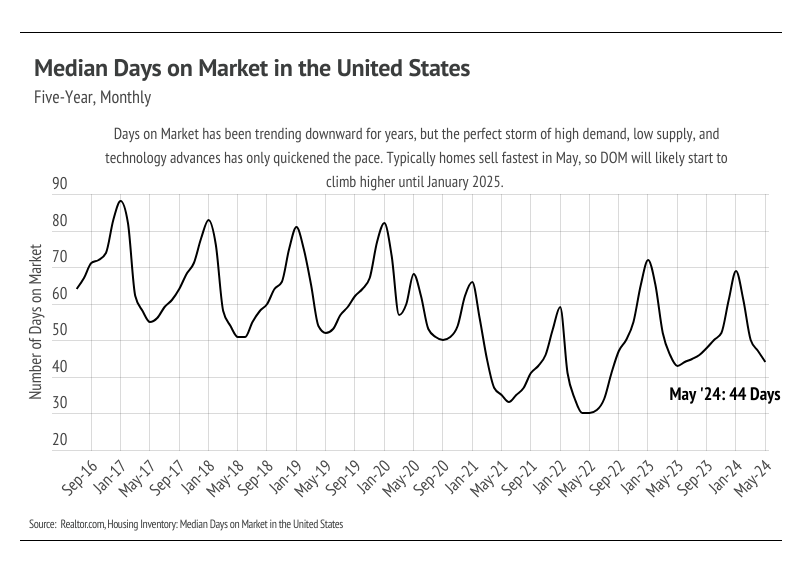
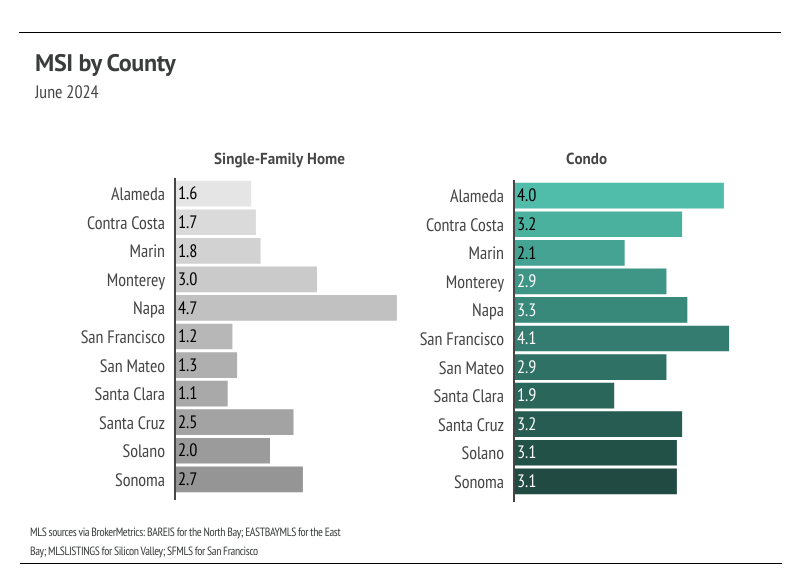
Surprisingly Unsurprising: High rates, High prices, High inventory
July 22, 2024
Monthly Market Update
July 22, 2024
Monthly Market Update
Stay up to date on the latest real estate trends.

July 24, 2026
A local agent's honest breakdown of cooling prices, fast sales, and a market that shifts block by block

July 16, 2026
A local agent's honest breakdown of tight inventory, conflicting price data, and a market split in two

July 15, 2026
A first-time buyer's guide to Below Market Rate homeownership, AMI tiers, and the city lottery process

July 10, 2026
A local agent's honest breakdown of prices, inventory, and buyer behavior across the city right now

July 6, 2026
What America's 250th birthday weekend revealed about life in San Francisco, Oakland, San Jose, Berkeley, Palo Alto, and beyond, plus what it means for the 2026 housing… Read more

October 27, 2025
Selling in Oakland’s competitive real estate market? Here are five expert strategies to help you attract buyers quickly and maximize your home’s value.

October 20, 2025
From pricing realities to neighborhood insights, here are the five key things every buyer should know before purchasing a home in San Jose.

October 13, 2025
From world-class schools and lush parks to a thriving real estate market, Palo Alto offers the perfect balance of innovation, lifestyle, and community.

October 6, 2025
San Francisco Real Estate Market Update — Fall 2025
You’ve got questions and we can’t wait to answer them.